The Sunny Side of the Street
SUNDAY
NIGHT - June 29, 2003
Archives of Past
Commentaries . How Did We Do?
Weekend Stock Picks --
CLICK HERE
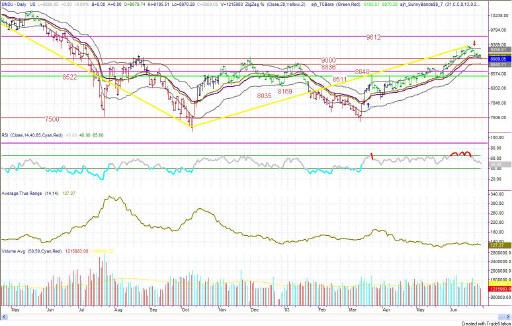
Figure 1a: COMPARISON: DOW vs SPY vs NASDAQ (Intraday)
In last time's commentary I said:
- The 4th wave, by my calculations today, could go as low as 8836 on the Dow and still qualify as a sideways move.
The Dow opened at 9079, rose to 9100 and then fell to 8989. The day certainly qualified as a sideways and congested type of day. It fits well within the suggestion of a 4th wave pennant.
Of note: the Dow dropped below the support at 9000, opening a hole for further descent to the 8836 level. If it had bounced off 9000 and gone up from there I would be thinking that would be the lower limit of the pennant formation; but since it penetrated 9000 to the downside, I am now looking for the Dow to go on down to the next level of support, which is at 8836, due to the high water marks left there in January of 2003.
| EDUCATION is not expensive; lack of education is! | |
| Consider this, how much can you lose on a single trade? How much should you pay for good advice? If you could make $1,000 per month trading advice that cost you $139.95 per month, would it be worth it? That's 7:1 odds! | |
| Subscribe now to The Sunny Side of the Street and SAVE. If you are receiving this commentary as part of the one-week trial and subscribe before the week runs out, your subscription will be only $99.95 per month, for as long as you are a continuous subscriber. If you wait, the regular subscription price is $139.95/month, which is still a great value! | |
| Like the indicators I use in this commentary? If you are a TradeStation user, you can have them on your computer, so you can follow along intraday! | |
| Need a MENTOR? Sunny is available for hourly consultation, or for extended studies. Call (888) 68-SUNNY...that's (888) 687-8669. | |
| How about help using or programming TradeStation? Give us a call. It's what I enjoy the most. |
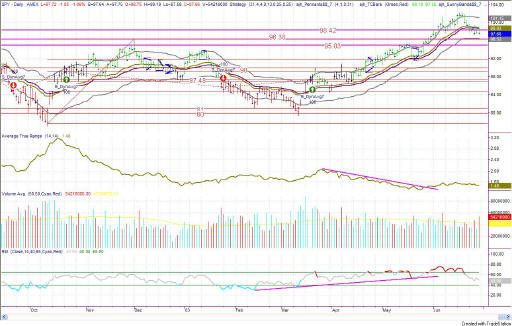
Figure 2a: SPY Daily
The daily SPY is trying to make its way to 96.38, where there is support from 12/2/2002. As yet, the SPY is showing strength by not falling that low. But, I think it will still drop down that last little bit in the very near future. That would also put price right at the bottom Sunny_Band, and would be a very good place for a bounce to occur.
Speaking loudly for that scenario is the divergent RSI over the past few weeks, and the fact that the RSI is just now at 48. The RSI at 48 puts it right in the middle (50) of bullish and bearish and thus calls for a move further down to at least 40 before a bounce upward is likely.
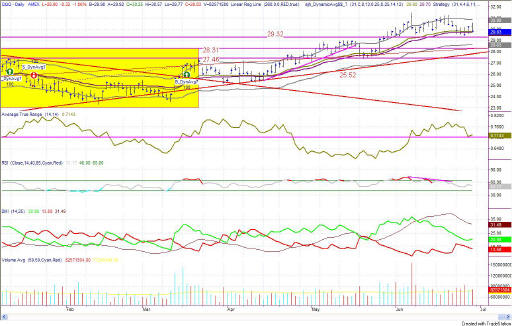
Figure 3a: QQQ Daily
The QQQ headed back toward the Yellow Box, but reversed itself before getting all the way down to the 28.31 line, which is the top of the Yellow Box. In fact, the bounce was off of the support line at 29.32, which I believe will be tried again this week. If the QQQs would spend the coming week doing nothing much other than playing around with the 29.32 line, that would qualify as a sideways 4th wave and the markets would be ready for the run upward to finish off the 5th wave up. It wouldn't take much.
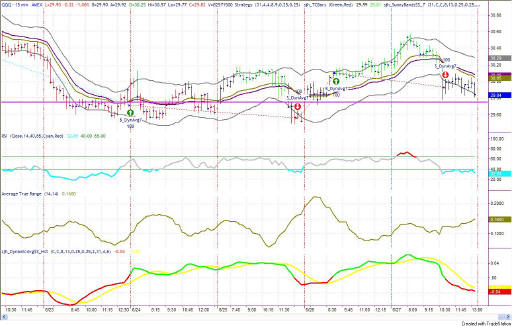
Figure 3b: QQQ 15-minute intraday
As the QQQ bars turned to black (with the Sunny_Bands_Pro indicator) the prices began touching the bottom Sunny_Band and by my rules of thumb, that was a place to begin looking for shorts. Not only that, but the SDMA model called for a short position.
Anyone following along on my Sunny_Dynamic_Moving_Average (SDMA) Histogram (the green and red line with yellow crossover in the bottom of the chart) would have jumped ahead of the signal by watching for the crossover of the yellow line by the green line. That could have been an early short.
Noting that I think this is a sideways 4th, it is time to be very wary of holding onto short positions much longer as they are likely to bounce at the nearest support.
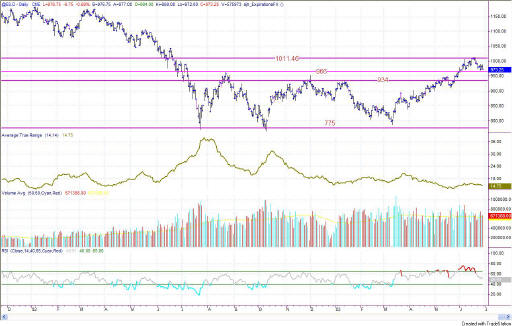
Figure 4a: EMini Daily bars
Support on the daily EMini looks to be at 966. The market has tried several times to drop lower, but keeps bouncing off that area. That's good news for the market. However, if the other indexes drop as low as their lines of support show, then the EMini will drop further as well.
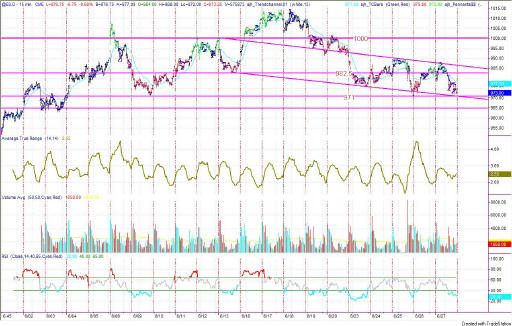
Figure 4b: EMini 15-minute intraday bars
Refer back to the commentary from the 26th about the construction of the two parallel lines in Figure 4b. Just click on Archives of Commentaries above, and click on the chosen date.
Friday's EMini moved gracefully up to touch the top parallel line from whence it bounced off and headed straight back down for the lower parallel line! And, it almost made it, but fell just slightly short.
That leads me to believe that Monday will fall slightly at the open and then bounce upward, heading back up for the top parallel line.
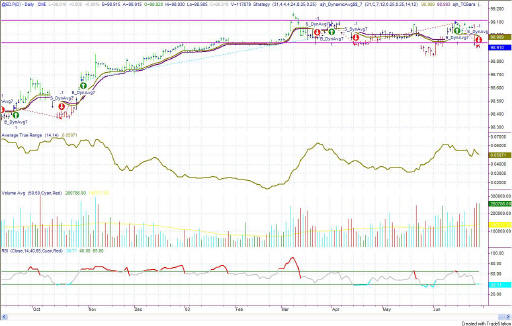
Figure 5a: EuroDollar Daily - Sunday night commentary only
The
current signal on the EuroDollar model is now short, as of Friday. I
am not interested yet in taking this signal, as it is not yet anything more
than one more sideways move in this topping action. My interest in
shorting this market will only come if the EuroDollar drops below 98.88.
Stay sharp and on your toes. We have had several up-days in a row, and a correction could come in the near future. But, as long as the markets are going up, they are going up--so I'm sticking with it.
RULES OF THUMB:
0. I keep the chart in Figure 1a on each day's commentary simply to illustrate how much in tandem the 4 indexes I watch actually are. For this reason, I don't always comment on every index. Analysis of one speaks highly for the same analysis for each of the other indexes.
1. When price is pushing the upper Sunny_Bands upward and then eases off and moves back toward the midline, it's time to take profits. If it starts moving up and pushing on the Sunny_Bands again, it's time to get back in. Likewise, if the market is pushing down on the lower Sunny_Band and eases off to move back to the midline, it's time to take profits from the short play.
2. Divergence of the RSI and price is another good time to take profits and wait for a breakout of price before taking a position.
3. When the exchange puts in curbs or trading halts on a large move down, it usually (not always) stops the downward motion. After the market reopens is a good time to take profits from your short position.
4. The market can't go nowhere forever. Eventually, who knows how long it will be, there will have to be a breakout-- one direction or the other.
==<:>==
While it may be true that a picture is worth a thousand words, it is definitely not true that a picture deserves a thousand words.
