The Sunny Side of the Street
TUESDAY
NIGHT - July 01, 2003
Archives of Past
Commentaries . How Did We Do?
Weekend Stock Picks --
CLICK HERE
Figure 1a: COMPARISON: DOW vs SPY vs NASDAQ (Intraday)
In last time's commentary I said:
- What's becoming more and more clear is that we are indeed forming the pennant that I called for more than a week ago. Prices are squeezing in and going nowhere, other than making an elongated sideways wiggle. Tomorrow should be more to the upside with higher lows and more choppy sideways action.
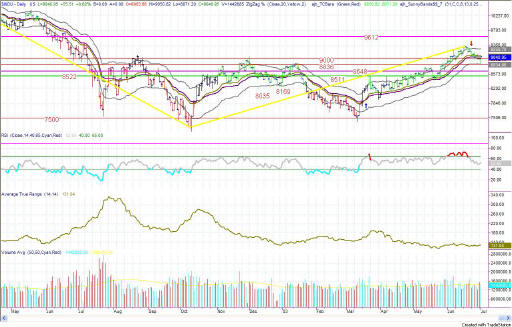
Today's Dow opened at 8983 and closed at 9040, with a dip in the beginning of the day down to 8871. That action showed today to indeed be a day to the upside, with significant downside action. In fact, the downside action took the Dow right down to a line of support that comes off of highs that were played with during the November to January timeframe. I had the line drawn at 8836, and the low today came in at 8834. Fantastic!
In making that move, today's Dow also touched the bottom Sunny_Band. The Sunny_Bands are beginning to look they might turn over and start moving downward. That would mean that the triangle I have been talking about could turn into an actual down move. At this point I still believe we just finished the 5th wave of a 3rd wave and are putting in a complex 4th wave filled with sideways and downward action.
- EDUCATION is not expensive; lack of education is!
- Consider this, how much can you lose on a single trade? How much should you pay for good advice? If you could make $1,000 per month trading advice that cost you $139.95 per month, would it be worth it? That's 7:1 odds!
- Subscribe now to The Sunny Side of the Street and SAVE. If you are receiving this commentary as part of the one-week trial and subscribe before the week runs out, your subscription will be only $99.95 per month, for as long as you are a continuous subscriber. If you wait, the regular subscription price is $139.95/month, which is still a great value!
- Like the indicators I use in this commentary? If you are a TradeStation user, you can have them on your computer, so you can follow along intraday!
- Need a MENTOR? Sunny is available for hourly consultation, or for extended studies. Call (888) 68-SUNNY...that's (888) 687-8669.
- How about help using or programming TradeStation? Give us a call. It's what I enjoy the most.

Figure 2a: SPY Daily
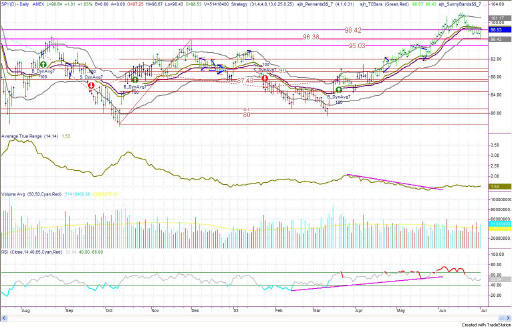
Today's SPY, dutifully behaving just like the Dow, touched down to it's lower support line which lies at 96.38--although the SPY didn't quite make it completely to the low. The SPY's low came in at 96.43, which is close enough! Only five 100ths off the mark.
Again I must say that it still looks like a corrective 4th wave to me.
The line of support that was touched today is formed by the low on 6/26/2002, and the high on 12/02/2002. That conjunction forms a pretty strong springboard from which to bounce, but the market may first make a few more attempts at pushing through the line. Markets seem to like forming bases at tops and bottoms both.

Figure 3a: QQQ 15-minute intraday
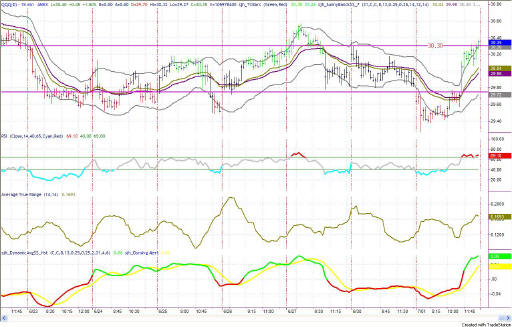
The support line on the daily QQQs that corresponds to the support lines on the Dow and SPY, lies at 29.32. Today's QQQ daily bar visually touches that line, but on closer inspection we can see that it actually gets only as low as 29.82. Still, that's pretty close. It leaves a half point for the QQQ to move on down before requiring a bounce or a blowoff.
On the 15-minute, intraday chart in Figure 3a you can see that the Sunny_Dynamic_MAV Histogram gives a nice early buy signal at 9:00am when the red line crosses over the yellow line--long before the red line turns green. You can also see that there is a nice line of support/resistance at the 30.30 level that held back any further movement to the upside today.
I expect tomorrow will continue on by adding more activity to the sideways action.

Figure 4a: EMini 15-minute intraday bars
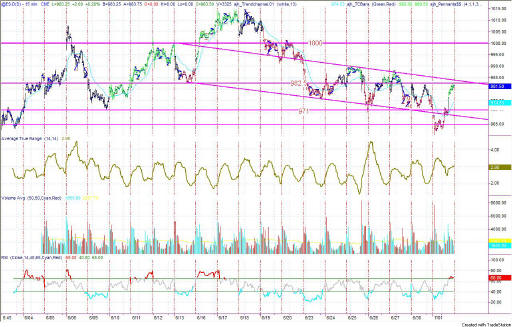
The parallel channel that I have been watching held beautifully today. Yest, the early morning action dropped below the bottom channel, but the EMini came back up above the channel and hesitated for a few tests of the channel line, and then it proceeded on up almost to the top channel line. I used the resistance line I had drawn at 982.50 to exit my long plays for the day, rather than waiting for the top channel to be reached. I am overly cautious these days about holding overnight and about lines of support and resistance.
Figure 5a: EuroDollar Daily - Sunday night commentary only
The
current signal on the EuroDollar model is now short, as of Friday. I
am not interested yet in taking this signal, as it is not yet anything more
than one more sideways move in this topping action. My interest in
shorting this market will only come if the EuroDollar drops below 98.88.
Stay sharp and on your toes. We have had several up-days in a row, and a correction could come in the near future. But, as long as the markets are going up, they are going up--so I'm sticking with it.
RULES OF THUMB:
0. I keep the chart in Figure 1a on each day's commentary simply to illustrate how much in tandem the 4 indexes I watch actually are. For this reason, I don't always comment on every index. Analysis of one speaks highly for the same analysis for each of the other indexes.
1. When price is pushing the upper Sunny_Bands upward and then eases off and moves back toward the midline, it's time to take profits. If it starts moving up and pushing on the Sunny_Bands again, it's time to get back in. Likewise, if the market is pushing down on the lower Sunny_Band and eases off to move back to the midline, it's time to take profits from the short play.
2. Divergence of the RSI and price is another good time to take profits and wait for a breakout of price before taking a position.
3. When the exchange puts in curbs or trading halts on a large move down, it usually (not always) stops the downward motion. After the market reopens is a good time to take profits from your short position.
4. The market can't go nowhere forever. Eventually, who knows how long it will be, there will have to be a breakout-- one direction or the other.
==<:>==
While it may be true that a picture is worth a thousand words, it is definitely not true that a picture deserves a thousand words.
