The Sunny Side of the Street
TUESDAY
NIGHT - July 15, 2003
Archives of Past
Commentaries . How Did We Do?
Weekend Stock Picks --
CLICK HERE
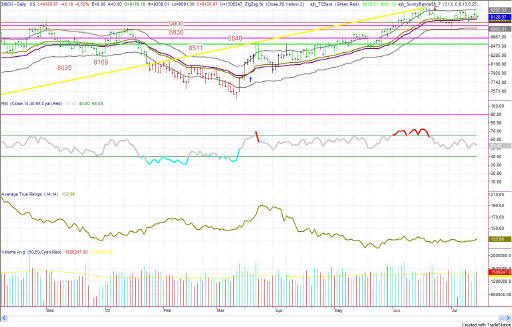
Figure 1a: COMPARISON: DOW vs SPY vs NASDAQ (Intraday)
In last time's commentary I said:
- ...we could easily see a temporary setback tomorrow as the Mutual Funds react to today's knee-jerk glitch in the markets. That sort of technical pull back would not be surprising, but neither would it surprise me if it doesn't happen tomorrow.
And today the QQQs made just such a correction. No way to tell whether it was related to mutual funds, but there are a lot of mutual fund switchers who do everything a day later and the funds are a lot larger than the individual traders who are trading a few shares at a time.
If the markets are building on the 5th wave, it's hard to tell from looking at the Dow, or the S&P for that matter. Both markets seem to be in disagreement with the QQQs. The Dow and the S&P seem to still be in a sideways move that needs channel numbers for breakouts, so I am going to set those in place now.
For the Dow 9327 on the top, 9000 on the bottom. One or the other of these Attractors (lines of support or resistance) must be broken before we can tell whether to go long or to go short. For the S&P, on the SPY: 102.10 on the top and 98.42 on the bottom. One or the other of these Attractors must be broken on the SPY before I will believe we are moving anything other than sideways.
| EDUCATION is not expensive; lack of education is! | |
| Consider this, how much can you lose on a single trade? How much should you pay for good advice? If you could make $1,000 per month trading advice that cost you $139.95 per month, would it be worth it? That's 7:1 odds! | |
| Subscribe now to The Sunny Side of the Street and SAVE. If you are receiving this commentary as part of the one-week trial and subscribe before the week runs out, your subscription will be only $99.95 per month, for as long as you are a continuous subscriber. If you wait, the regular subscription price is $139.95/month, which is still a great value! | |
| Like the indicators I use in this commentary? If you are a TradeStation user, you can have them on your computer, so you can follow along intraday! | |
| Need a MENTOR? Sunny is available for hourly consultation, or for extended studies. Call (888) 68-SUNNY...that's (888) 687-8669. | |
| How about help using or programming TradeStation? Give us a call. It's what I enjoy the most. |
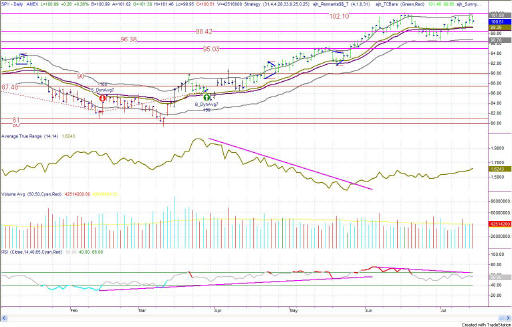
Figure 2a: SPY Daily
The SPY's movement today basically just undid yesterday's movement. Here today, gone tomorrow. Up one day, down the next. Until the market breaks above the levels stated above, then I believe we are still just treading water, churning sideways.
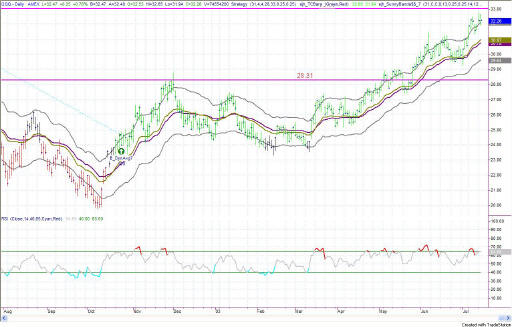
Figure 3a: QQQ Daily
This little beauty, on the other hand, is trading and tradable. The QQQ continues to edge its way on upward for the 33 mark, despite today's corrective action. Setting stops tighter under the QQQ market and continuing to hold long since the breakout of the upper Sunny_Band is still the order for the day.
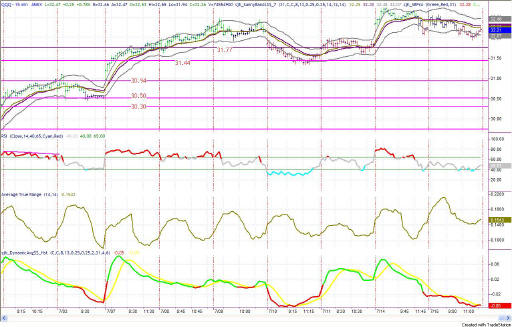
Figure 3b: QQQ 15-minute intraday
Today's intraday action on the QQQ looked a bit more like a pennant than anything else, causing me to think that we are still in for more upside action. Nevertheless, keep stops tight, just under current intraday activity at about 31.70. That way stops will stay under the Attractor that is sitting at 31.77, in case of a bounce.
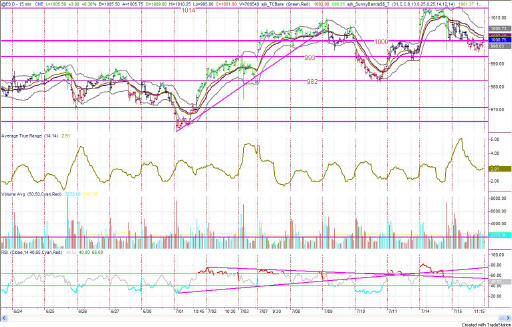
Figure 4a: EMini 15-minute intraday bars
The EMini made the sharpest move down of "my" markets, dropping below the Attractor at 1000, after first making some concerted effort to stay above the line. Then at 10:00 amPST, which is about midday EST, the EMini dropped further. The rest of the day was spent trying to make it back above the 1000 line. If this movement continues down much further, then it won't be a 4wave after all and the bag is up for grabs as far as the current count on the EMini goes.
Again, my best bet here is to wait for a breakout of the current trading range before making any commitments.

Figure 5a: EuroDollar Daily - Sunday night commentary only
The
current signal on the EuroDollar model is still short, with nothing yet to
confirm the signal. My interest in
shorting this market will only come if the EuroDollar drops below 98.88.
Until then, I stand neutral. This commentary still holds, a week
later.
Stay sharp and on your toes. Moves can reverse on a dime, anytime. Let the market speak to you. If the market is going down, by golly ignore my commentary from the night before and know that the market is going down.
RULES OF THUMB:
0. I keep the chart in Figure 1a on each day's commentary simply to illustrate how much in tandem the 4 indexes I watch actually are. For this reason, I don't always comment on every index. Analysis of one speaks highly for the same analysis for each of the other indexes.
1. When price is pushing the upper Sunny_Bands upward and then eases off and moves back toward the midline, it's time to take profits. If it starts moving up and pushing on the Sunny_Bands again, it's time to get back in. Likewise, if the market is pushing down on the lower Sunny_Band and eases off to move back to the midline, it's time to take profits from the short play.
2. Divergence of the RSI and price is another good time to take profits and wait for a breakout of price before taking a position.
3. When the exchange puts in curbs or trading halts on a large move down, it usually (not always) stops the downward motion. After the market reopens is a good time to take profits from your short position.
4. The market can't go nowhere forever. Eventually, who knows how long it will be, there will have to be a breakout-- one direction or the other.
5. This commentary is for educational purposes only, and is meant only to teach readers about my indicators, other technical indicators, and how I read them.
==<:>==
While it may be true that a picture is worth a thousand words, it is definitely not true that a picture deserves a thousand words.
