The Sunny Side of the Street
TUESDAY
NIGHT - July 22, 2003
Archives of Past
Commentaries . How Did We Do?
Weekend Stock Picks --
CLICK HERE
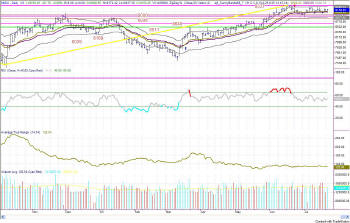
Figure 1a: COMPARISON: DOW vs SPY vs NASDAQ (Intraday)
Up about a half percent for the day, the Dow opened at 9098 Tuesday and closed at 9158. The markets are still moving sideways, up 1/2 percent one day and down 1/2 percent the next.
Nothing much is changing yet, though I still expect higher highs in the near future.
RSI is still drifting sideways, too; but, it is holding steady in the highwater area, staying well above the 40 mark.
Followers of the SDMA and the rules of thumb below are still neutral, waiting for something to show its hand after a long run up.
Just hang out there, something will happen, but don't jump the gun or you'll just waste money getting whipsawed.
- EDUCATION is not expensive; lack of education is!
- Consider this, how much can you lose on a single trade? How much should you pay for good advice? If you could make $1,000 per month trading advice that cost you $139.95 per month, would it be worth it? That's 7:1 odds!
- Subscribe now to The Sunny Side of the Street and SAVE. If you are receiving this commentary as part of the one-week trial and subscribe before the week runs out, your subscription will be only $99.95 per month, for as long as you are a continuous subscriber. If you wait, the regular subscription price is $139.95/month, which is still a great value!
- Like the indicators I use in this commentary? If you are a TradeStation user, you can have them on your computer, so you can follow along intraday!
- Need a MENTOR? Sunny is available for hourly consultation, or for extended studies. Call (888) 68-SUNNY...that's (888) 687-8669.
- How about help using or programming TradeStation? Give us a call. It's what I enjoy the most.
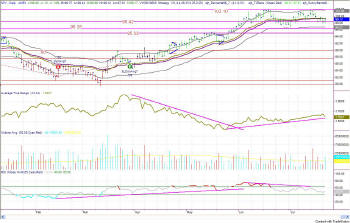
Figure 2a: SPY Daily
Same story, same picture, different vehicle. The SPY is also going sideways, and is now below a sideways Sunny_Band on a closing basis. To me this just says to be neutral until the model gets a sell signal or until prices cross below the lower Sunny_Band.
The RSI is low enough to start another leg to the upside, with another bullish leg in the market, but it is probably a day or more away.
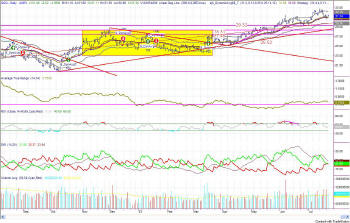
Figure 3a: QQQ Day bars
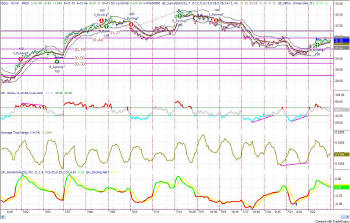
Figure 3b: QQQ 15-minute IntraDay bars
At least the QQQ does a little moving intraday, which was enough today to turn the model to a buy signal. The positive divergence on the RSI from yesterday did its trick today. So, the nearby reversal happened, and I expect tomorrow to be a continuation of today's up move.

Figure 4a: EMini 15-minute Intraday
Likewise here, as compared to
the QQQs. The model SDMA is now long, though nothing real exciting.
Tomorrow and the following day might give a little excitement as the
Attractor overhead at 993 just might pull the market on up a bit higher.
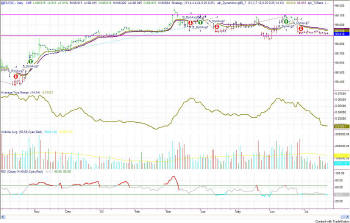
Figure 5a: EuroDollar Daily - Sunday night commentary only
The current signal on the EuroDollar model is still short, with nothing yet to confirm or deny the signal. My interest in shorting this market will only come if the EuroDollar drops below 98.88. Until then, I stand neutral. This commentary still holds, three(!) weeks later, with the ED moving ever so slowly sideways.
And they told me
currencies trend. This is some trend ok.
Stay sharp and on your toes. Moves can reverse on a dime, anytime. Let the market speak to you. If the market is going down, by golly ignore my commentary from the night before and know that the market is going down.
RULES OF THUMB:
0. I keep the chart in Figure 1a on each day's commentary simply to illustrate how much in tandem the 4 indexes I watch actually are. For this reason, I don't always comment on every index. Analysis of one speaks highly for the same analysis for each of the other indexes.
1. When price is pushing the upper Sunny_Bands upward and then eases off and moves back toward the midline, it's time to take profits. If it starts moving up and pushing on the Sunny_Bands again, it's time to get back in. Likewise, if the market is pushing down on the lower Sunny_Band and eases off to move back to the midline, it's time to take profits from the short play.
2. Divergence of the RSI and price is another good time to take profits and wait for a breakout of price before taking a position.
3. When the exchange puts in curbs or trading halts on a large move down, it usually (not always) stops the downward motion. After the market reopens is a good time to take profits from your short position.
4. The market can't go nowhere forever. Eventually, who knows how long it will be, there will have to be a breakout-- one direction or the other.
5. This commentary is for educational purposes only, and is meant only to teach readers about my indicators, other technical indicators, and how I read them.
==<:>==
While it may be true that a picture is worth a thousand words, it is definitely not true that a picture deserves a thousand words.
