The Sunny Side of the Street
TUESDAY
NIGHT - July 29, 2003
Archives of Past
Commentaries . How Did We Do?
Weekend Stock Picks --
CLICK HERE
Figure 1a: COMPARISON: DOW vs SPY vs NASDAQ (Intraday)

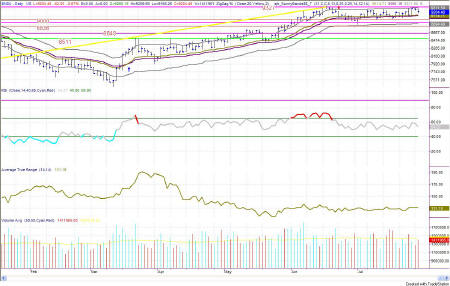
Figure 1a: INDU Daily chart
The headlines on CNNfn read, "Dow slides," "Stocks Slip," and yet with a net of minus 62 points on the Dow, the day actually looked once again like a sideways day.
Looking at today's bar on the QQQ looks like another inverse day from the day before. More than anything, it looks like an Ascending Triangle still forming. If so, then that probably means we are soon coming to another upswing leg in the markets.
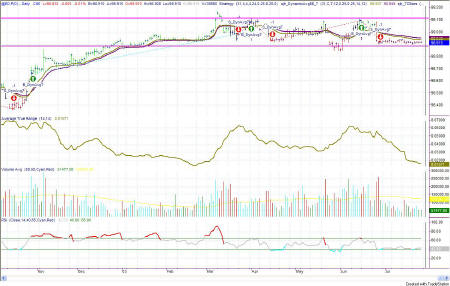
Note on the charts in Figure 1a and 3a, that the down-arrow has been on since June 23. That arrow, per my commentary, was turned on not as a short signal, but as a signal to exit longs. On the daily charts I have not issued an alert to consider longs or shorts since the end of June. I still do not see the technical analysis requisite to cause me to change my mind as yet.
- EDUCATION is not expensive; lack of education is!
- Consider this, how much can you lose on a single trade? How much should you pay for good advice? If you could make $1,000 per month trading advice that cost you $139.95 per month, would it be worth it? That's 7:1 odds!
- Subscribe now to The Sunny Side of the Street and SAVE. If you are receiving this commentary as part of the one-week trial and subscribe before the week runs out, your subscription will be only $99.95 per month, for as long as you are a continuous subscriber. If you wait, the regular subscription price is $139.95/month, which is still a great value!
- Like the indicators I use in this commentary? If you are a TradeStation user, you can have them on your computer, so you can follow along intraday!
- Need a MENTOR? Sunny is available for hourly consultation, or for extended studies. Call (888) 68-SUNNY...that's (888) 687-8669.
- How about help using or programming TradeStation? Give us a call. It's what I enjoy the most.
Today's daily bar on the QQQ simply touched back down (almost) to the Sunny_DMA line. While possibly creating what is now beginning to look like an extended Head & Shoulders pattern, the daily QQQs are still moving sideways as well, at the moment.

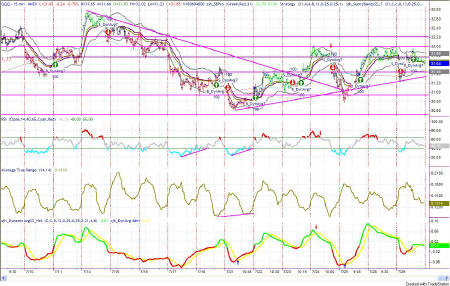
Figure 3b: QQQ 15 minute intraday
The intraday chart of the QQQs is also looking like an ascending triangle. I am still watching the market for a potential break of the 32.20 line and a run to 32.80-33.00.
Technically, watch the lower ascending trendline to see whether it gets broken or "bettered."

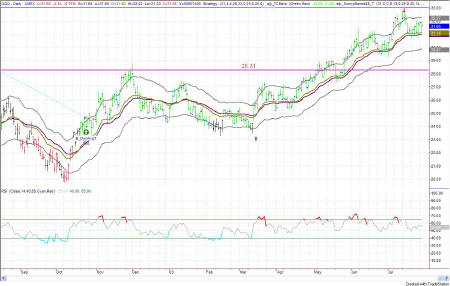
Figure 5a: EuroDollar Daily - Sunday night commentary only
The current signal on the EuroDollar model is still short, with nothing yet to confirm or deny the signal. My interest in shorting this market will only come if the EuroDollar drops below 98.88. Until then, I stand neutral. This commentary still holds, four(!) weeks later, with the ED moving ever so slowly sideways.
And they told me
currencies trend. This is some trend ok!
Stay sharp and on your toes. Moves can reverse on a dime, anytime. Let the market speak to you. If the market is going down, by golly ignore my commentary from the night before and know that the market is going down.
RULES OF THUMB:
0. I keep the chart in Figure 1a on each day's commentary simply to illustrate how much in tandem the 4 indexes I watch actually are. For this reason, I don't always comment on every index. Analysis of one speaks highly for the same analysis for each of the other indexes.
1. When price is pushing the upper Sunny_Bands upward and then eases off and moves back toward the midline, it's time to take profits. If it starts moving up and pushing on the Sunny_Bands again, it's time to get back in. Likewise, if the market is pushing down on the lower Sunny_Band and eases off to move back to the midline, it's time to take profits from the short play.
2. Divergence of the RSI and price is another good time to take profits and wait for a breakout of price before taking a position.
3. When the exchange puts in curbs or trading halts on a large move down, it usually (not always) stops the downward motion. After the market reopens is a good time to take profits from your short position.
4. The market can't go nowhere forever. Eventually, who knows how long it will be, there will have to be a breakout-- one direction or the other.
5. This commentary is for educational purposes only, and is meant only to teach readers about my indicators, other technical indicators, and how I read them.
==<:>==
While it may be true that a picture is worth a thousand words, it is definitely not true that a picture deserves a thousand words.
