The Sunny Side of the Street
THURSDAY
NIGHT - August 14, 2003
Archives of Past
Commentaries . How Did We Do?
Weekend Stock Picks --
CLICK HERE
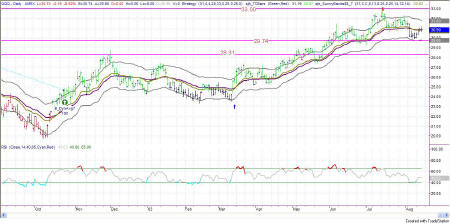
Figure 1a: COMPARISON: DOW vs SPY vs NASDAQ (Intraday)
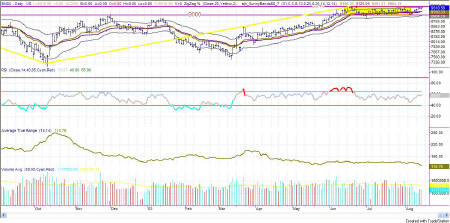
Figure 1a: INDU Daily chart
Still in the box! What more can I say?
Until the Dow breaks out of the box, it is still in the box. That's how the Sunny_Bands were developed: on the premise that the market tends to go where it tends to go. So, as long as the market doesn't break out, we can expect (at least technically) for the market to continue to (a) play sideways along the upper resistance at 9340, or (b) to drop down to the lower support at 9000.
| Consider this, how much can you lose on a single trade? How much should you pay for good advice? If you could make $1,000 per month trading advice that cost you $139.95 per month, would it be worth it? That's 7:1 odds! | |
| Subscribe now to The Sunny Side of the Street and SAVE. If you are receiving this commentary as part of the one-week trial and subscribe before the week runs out, your subscription will be only $99.95 per month, for as long as you are a continuous subscriber. If you wait, the regular subscription price is $139.95/month, which is still a great value! | |
| EDUCATION is not expensive; lack of education is! |
The QQQ is still falling, compared to the Dow. Although the past three days have been up days, intraday, the current trend (a la Linear Regression slope) is down. Today and yesterday's daily pushed on the middle Sunny_Band, giving some hope of strength, but until it pushes the top band, it's too soon for me to place long bets.
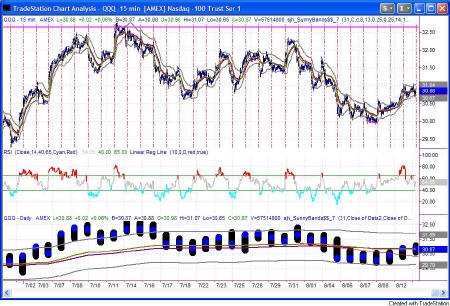
Figure 2b: QQQ 15 minute intraday
Intraday the QQQ opened at 30.88 and closed at 30.91, which qualifies as a sideways move in my book. It accomplished this move in a haphazard fashion, however, running up for most of the day and closing on a huge single bar back down.
The key Attractor is at 31.02, which is the high of yesterday and the low at 8/05 7:30a. It also hits lots of other highs and lows along the past, which makes it pretty significant. This is the line I think the QQQ will be playing with for a few more days.
The next Attractor up is at 31.37, which I think will be drawing prices up toward it at the same time that 31.02 is pulling downward.
RSI is currently in divergence with price, which usually calls for corrective action. If the divergence takes hold it should pull down to about 30.61.
| Like the indicators I use in this commentary? If you are a TradeStation user, you can have them on your computer, so you can follow along intraday! | |
| Need a MENTOR? Sunny is available for hourly consultation, or for extended studies. Call (888) 68-SUNNY...that's (888) 687-8669. | |
| How about help using or programming TradeStation? Give us a call. It's what I enjoy the most. |
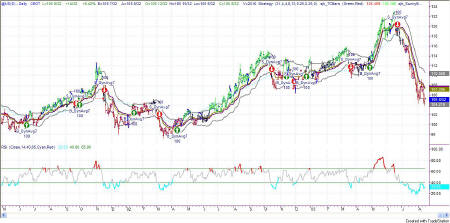
Figure 3: US TBonds daily
The bonds chart is still short, and a beautiful short it is. The divergence that led up to this correction was beautifully in place by 6/16. The RSI dip down to 19 put it lower than we have seen it in a long while, and led to a quick reversal, which didn't hold. The bars are still red, and beneath the midline of the Sunny_Band, giving no hope as yet for any upside action.
Today's low broke the previous low, calling for more shorting, and rising interest rates. However, price should rest near the 105 Attractor and begin to play back and forth along that line.
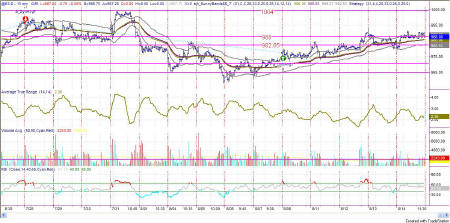
Figure 4: EMini intraday
Today's EMini played beautifully along the 988 Attractor, moving there first thing in the morning and staying there the rest of the day. The sideways channel still runs from 1004 down to 964. I think the current buy signal will likely take the EMini as high as 997 before the ride gets too scary.
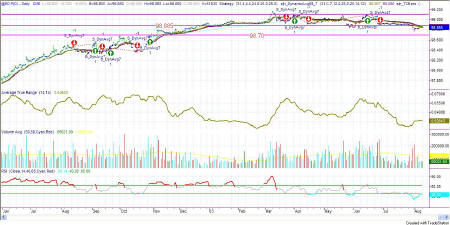
Figure 5a: EuroDollar Daily - Sunday night commentary only
The next Attractor is now down at 98.7, which could be a nice profit taking opportunity. Why? Because the RSI has been so low that I would expect a bounce when that level is tested. The RSI itself has had a little bounce, but I expect it will use the 40 level as resistance and drop a little further from here.
Stay sharp and on your toes. Moves can reverse on a dime, anytime. Let the market speak to you. If the market is going down, by golly ignore my commentary from the night before and know that the market is going down.
RULES OF THUMB:
0. I keep the chart in Figure 1a on each day's commentary simply to illustrate how much in tandem the 4 indexes I watch actually are. For this reason, I don't always comment on every index. Analysis of one speaks highly for the same analysis for each of the other indexes.
1. When price is pushing the upper Sunny_Bands upward and then eases off and moves back toward the midline, it's time to take profits. If it starts moving up and pushing on the Sunny_Bands again, it's time to get back in. Likewise, if the market is pushing down on the lower Sunny_Band and eases off to move back to the midline, it's time to take profits from the short play.
2. Divergence of the RSI and price is another good time to take profits and wait for a breakout of price before taking a position.
3. When the exchange puts in curbs or trading halts on a large move down, it usually (not always) stops the downward motion. After the market reopens is a good time to take profits from your short position.
4. The market can't go nowhere forever. Eventually, who knows how long it will be, there will have to be a breakout-- one direction or the other.
5. This commentary is for educational purposes only, and is meant only to teach readers about my indicators, other technical indicators, and how I read them.
==<:>==
While it may be true that a picture is worth a thousand words, it is definitely not true that a picture deserves a thousand words.
