The Sunny Side of the Street
MONDAY MORNING - August 18, 2003
Archives of Past
Commentaries . How Did We Do?
Weekend Stock Picks --
CLICK HERE
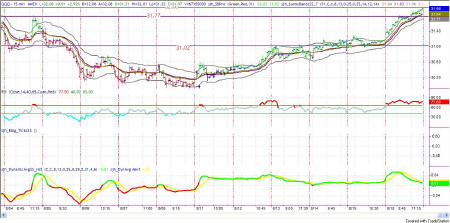
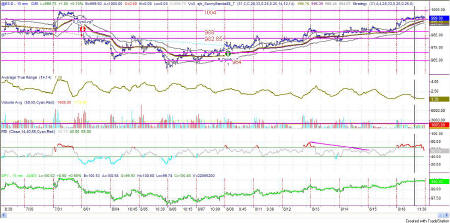
Figure 1a: COMPARISON: DOW vs SPY vs NASDAQ (Intraday)
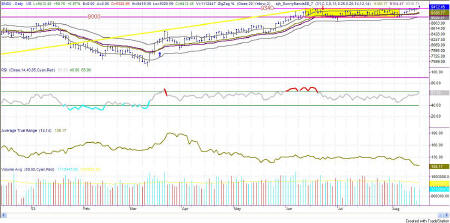
Figure 2a
At last! Today's Dow high, and today's close, were above the top line of the yellow box! A breakout has occurred. I therefore believe that we are in the 5th wave of this upswing. By my calculations it should reach 10,000 (or more precisely 10,207) on the Dow by the end of this wave.
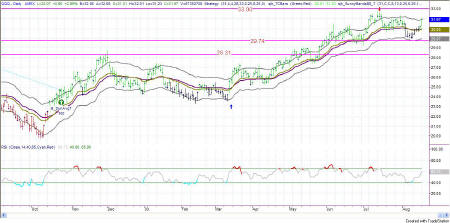
Figure 2a: QQQ Daily
The QQQs have not been reacting as steadily upward as the Dow over the past few weeks, but today's action put the closing price right on the top Sunny_Band, thus giving a buy signal.
RSI does not deny this technical signal, as it sits right in the middle between Connie Brown's 40-65 range, after making a correction down to the 40 line and taking a bounce.
In Figure 2b you can see that the QQQ hesitated for almost two hours at the 31.77 line before moving on upward to the Attractor at 32, where it closed at 31.98.
My expectation now is for the QQQ to make a run upward to the next higher Attractor at 32.27.
With the RSI in highly overbought territory, one would be suspicious of further upward movement, but RSI can stay overbought in a bull market for a long time. Does that mean that we are in a bull market?
Not yet, by my count. It still looks and acts like a sideways market. But, it only seems logical that the market is going to try now to break out from overhead resistance. Today's breakout penetrated resistance that was 11 days old. I expect tomorrow to break the 13 day old resistance.
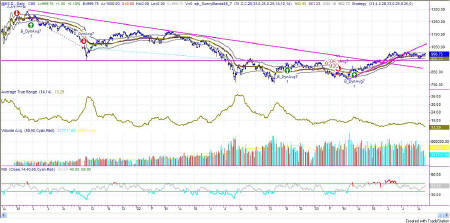
Figure 3a: EMini Daily
The EMini today behaved a bit differently than the Dow and QQQ. Instead of having a second run up in the afternoon, the EMini did all of its running in the morning and then slid sideways on the Attractor for the rest of the afternoon (Figure 3b).
The closing price on the EMini stopped right at the upper Attractor of 999, which emanates from the highs of and lows of 6/17/2003. It looks like a pretty solid Attractor, but I think the rise will continue to the Attractor at 1004, which is much more solid.
Prices have been staying well above the midline of the Sunny_Bands for most of the past 8 days. That is good evidence for continued upward movement until the Sunny_Band midline is broken. Profit taking is a good idea when price penetrates the lower gray line (lower band) of the Sunny_Bands, which currently lies at 994.58.
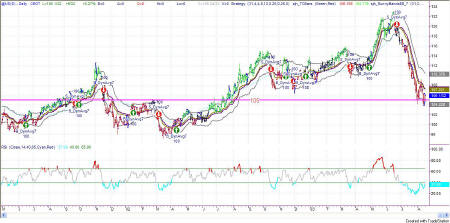
Figure 4a: US TBonds Daily
The bars on the chart in Figure 4a still show red, and lots of it. That means that closing prices are below the midline of the Sunny_Bands, where they have stayed since the sell signal at the top of the turn on 6/20/2003. There has been some slowing and wavering as the Attractor at 105 is being tested. And, now there is a pennant formation denoting congestion, as well. With RSI holding solidly below the 40 delimiter, I think the fall is slowing down and could easily become a sideways move for a while as the Attractor gets more testing.
Stay sharp and on your toes. Moves can reverse on a dime, anytime. Let the market speak to you. If the market is going down, by golly ignore my commentary from the night before and know that the market is going down.
RULES OF THUMB:
0. I keep the chart in Figure 1a on each day's commentary simply to illustrate how much in tandem the 4 indexes I watch actually are. For this reason, I don't always comment on every index. Analysis of one speaks highly for the same analysis for each of the other indexes.
1. When price is pushing the upper Sunny_Bands upward and then eases off and moves back toward the midline, it's time to take profits. If it starts moving up and pushing on the Sunny_Bands again, it's time to get back in. Likewise, if the market is pushing down on the lower Sunny_Band and eases off to move back to the midline, it's time to take profits from the short play.
2. Divergence of the RSI and price is another good time to take profits and wait for a breakout of price before taking a position.
3. When the exchange puts in curbs or trading halts on a large move down, it usually (not always) stops the downward motion. After the market reopens is a good time to take profits from your short position.
4. The market can't go nowhere forever. Eventually, who knows how long it will be, there will have to be a breakout-- one direction or the other.
5. This commentary is for educational purposes only, and is meant only to teach readers about my indicators, other technical indicators, and how I read them.
==<:>==
While it may be true that a picture is worth a thousand words, it is definitely not true that a picture deserves a thousand words.
