
The Sunny Side of the Street
TECHNICAL ANALYSIS EDUCATION: EXPLAINED AND DECIPHERED FOR NEW AND
VETERAN TECHNICAL ANALYSTS ALIKE.
TUESDAY EVENING - August
26, 2003
Archives of Past
Commentaries . How Did We Do?
Weekend Stock Picks --
CLICK HERE
Figure 1a: COMPARISON: DOW vs SPY vs NASDAQ (Intraday)
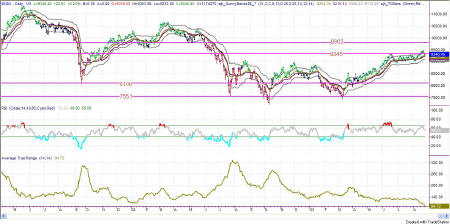
Figure 2a: Dow Industrials on a daily basis
The Dow is still testing the Attractor at 9345, dropping on the open and then catching back up in the afternoon. Price touched the Attractor, but then backed off just a bit to close at 9340. It's still slow going, but it is continuing to make progress.
RSI is still in negative divergence, which is a warning that things might turn sour. The ATR is narrowing down so that now it is as low as 94 points. Nevertheless, I think the Dow is working on meeting up with the Attractor at 9802.
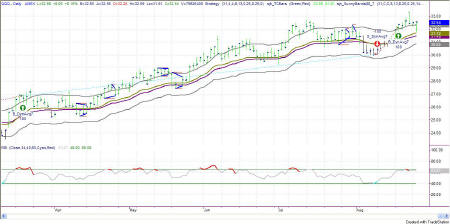
Figure 2a: QQQ Daily
Well, I got the direction right, but the strength of the move just wasn't there for today. The intraday QQQ was met with overhead resistance before reaching the 32.69 line. Neverthess, the direction was upward, after a falter in the early morning. Whether you went long at the open, or went long after the sideways doldrums, there was a nice little profit the be caught.
The automated SDMA system gave a buy signal at 12:45 at 32.44. But, because the past few signals on this chart have been long (time-wise) plays, and caught large hunks of the moves, I am wary of this signal. All too often, after a few good calls, the system will whipsaw around and give 3 or 4 erroneous calls. So, I'm watching carefully for breakouts, rather than just jumping into the signals for the next few weeks.
This signal did get higher closes after the signal was given, so it looks like a safe entry.
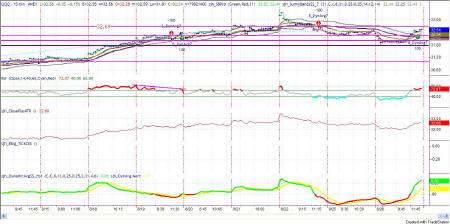
Figure 2b: QQQ 15-minute Intraday
Today's QQQ didn't get as high as testing the Attractor at 33.8, but it did head for that mark, closing at 32.54.
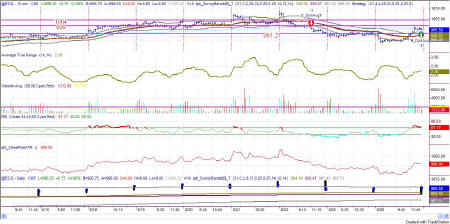
Figure 3a: EMini Intraday and Daily
Last night I said: "Generally I would be looking for the market to bounce back upward in this configuration, and I think that's where we will probably see the market move tomorrow: back up to 995.48 or so." And today the EMini closed at 995.50. Excellent!
I think tomorrow is to be another up day, with the Attractor at 999 being the play for the day. With the ATR being only 2.36, the EMini will probably only make it half way there in a single day, but that's where it seems to be headed.
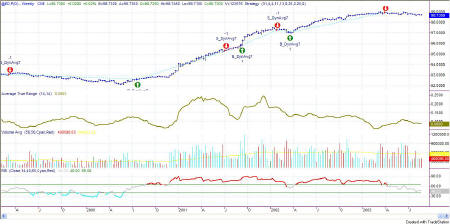
Figure 5a: EuroDollar Weekly
The long-term nature of trends in currencies still has us short the Euro. Bit by bit it keeps drifting on downward, but nothing in a hurry. In the general nature of currencies, this trend is taking a long time to get established and a long time in the trending.
This commentary is meant only for EDUCATIONAL PURPOSES. It is to help you see how a Technical Analyst reads the signs in the markets.
Stay sharp and on your toes. Moves can reverse on a dime, anytime. Let the market speak to you. If the market is going down, by golly ignore my commentary from the night before and know that the market is going down.
RULES OF THUMB:
0. I keep the chart in Figure 1a on each day's commentary simply to illustrate how much in tandem the 4 indexes I watch actually are. For this reason, I don't always comment on every index. Analysis of one speaks highly for the same analysis for each of the other indexes.
1. When price is pushing the upper Sunny_Bands upward and then eases off and moves back toward the midline, it's time to take profits. If it starts moving up and pushing on the Sunny_Bands again, it's time to get back in. Likewise, if the market is pushing down on the lower Sunny_Band and eases off to move back to the midline, it's time to take profits from the short play.
2. Divergence of the RSI and price is another good time to take profits and wait for a breakout of price before taking a position.
3. When the exchange puts in curbs or trading halts on a large move down, it usually (not always) stops the downward motion. After the market reopens is a good time to take profits from your short position.
4. The market can't go nowhere forever. Eventually, who knows how long it will be, there will have to be a breakout-- one direction or the other.
5. This commentary is for educational purposes only, and is meant only to teach readers about my indicators, other technical indicators, and how I read them.
==<:>==
While it may be true that a picture is worth a thousand words, it is definitely not true that a picture deserves a thousand words.