The Sunny Side of the Street
TECHNICAL ANALYSIS EDUCATION: EXPLAINED AND DECIPHERED FOR NEW AND
VETERAN TECHNICAL ANALYSTS ALIKE.
WEDNESDAY EVENING -
Sept 3, 2003
Archives of Past
Commentaries . How Did We Do?
Weekend Stock Picks --
CLICK HERE
Figure 1a: COMPARISON: DOW vs SPY vs NASDAQ (Intraday)

Figure 2a: Dow Industrials on a daily basis
True to last night's commentary, "It's probably about time for a little rest before continuing the climb to 9802." Today's Dow spent the day going sideways. The high for the day was 9609 and the low was 9541. The close was at 9587, qualifying today as a breakout day from yesterday's breakout levels.
Stop loss at the low of today, at 9541, and watch for the next
Attractor at 9682.

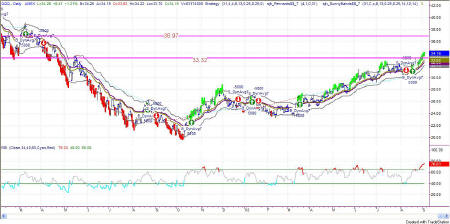
Figure 2a: QQQ Daily
On the daily chart, the QQQ is performing nicely, still pushing upward on the top Sunny_Band. It is altogether quite bullish. RSI is in bullish territory at 76.03 on the daily chart, and could continue holding up in that level for several more days.
More than likely, however, would be the scenario where the QQQ fell down to retest previous resistance, which is now support, at the 33.32 level.

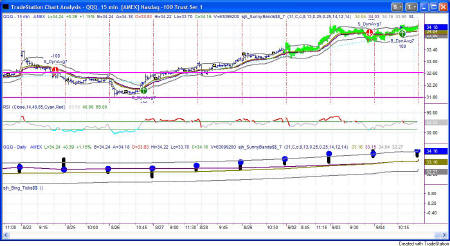
Figure 2b: QQQ 15-minute Intraday
Today was a sideways trap kind of day. Any system signals were too late by the time they were triggered, as the market put it more sideways correction today.
Breakout points on the QQQ are: 34.22 on the upside and 33.66 on the downside. No reason to trade a sideways shuffle--wait for a breakout one direction or the other.

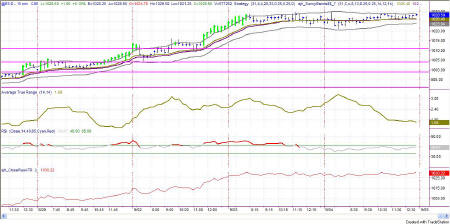
Figure 3a: EMini Intraday and Daily
More sideways correction today, showing bullish behavior by going sideways rather than straight down.
The breakouts would be at: 1021.63 on the lower side and 1029.29 on the upper side. Without a breakout there's no reason to trade during this sideways period. Keep on your toes and watch for these two levels to be broken.

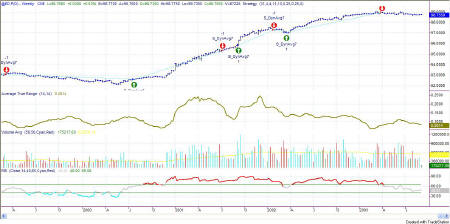
Figure 5a: EuroDollar Weekly
The long-term nature of trends in currencies
still has us short the Euro. Bit by bit it keeps drifting on downward,
but nothing in a hurry. In the general nature of currencies, this
trend is taking a long time to get established and a long time in the
trending.
This commentary is meant only for EDUCATIONAL PURPOSES. It is to help you see how a Technical Analyst reads the signs in the markets.
Stay sharp and on your toes. Moves can reverse on a dime, anytime. Let the market speak to you. If the market is going down, by golly ignore my commentary from the night before and know that the market is going down.
RULES OF THUMB:
0. I keep the chart in Figure 1a on each day's commentary simply to illustrate how much in tandem the 4 indexes I watch actually are. For this reason, I don't always comment on every index. Analysis of one speaks highly for the same analysis for each of the other indexes.
1. When price is pushing the upper Sunny_Bands upward and then eases off and moves back toward the midline, it's time to take profits. If it starts moving up and pushing on the Sunny_Bands again, it's time to get back in. Likewise, if the market is pushing down on the lower Sunny_Band and eases off to move back to the midline, it's time to take profits from the short play.
2. Divergence of the RSI and price is another good time to take profits and wait for a breakout of price before taking a position.
3. When the exchange puts in curbs or trading halts on a large move down, it usually (not always) stops the downward motion. After the market reopens is a good time to take profits from your short position.
4. The market can't go nowhere forever. Eventually, who knows how long it will be, there will have to be a breakout-- one direction or the other.
5. This commentary is for educational purposes only, and is meant only to teach readers about my indicators, other technical indicators, and how I read them.
==<:>==
While it may be true that a picture is worth a thousand words, it is definitely not true that a picture deserves a thousand words.