
The Sunny Side of the Street
TECHNICAL ANALYSIS EDUCATION: EXPLAINED AND DECIPHERED FOR NEW AND
VETERAN TECHNICAL ANALYSTS ALIKE.
WEDNESDAY EVENING -
Sept 10, 2003
Archives of Past
Commentaries . How Did We Do?
Weekend Stock Picks --
CLICK HERE
Figure 1a: COMPARISON: DOW vs SPY vs NASDAQ (Intraday)
$44,893 in Stock Picks to date! Click Here to view.
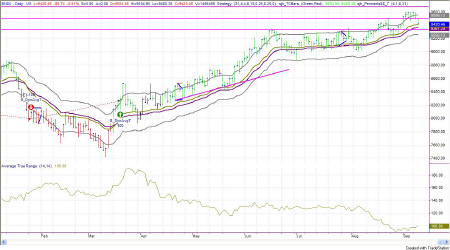
Figure 2a: Dow Industrials on a daily basis
BEWARE: all technical bets are off if tomorrow's anniversary date brings with it terrorism. Let us pray all around the world for peace and mercy instead.
I have been warning you of an impending correction from the Technicals for several days, and here it is. Back in the "old days" a correction would pack a whallop and shave off 200-300 points before it was even considered a correction, but nowadays moves are more like today's 80+ points in the downward direction. So, it's a correction.
The downward move went right to an Attractor, just as neat as you please, moving to the Sunny_DMA midline, at 9420. Where will it go from here? Or, is the correction over?
I believe we will see 9325 on the Dow, moving down just a bit more, to the next lower Attractor. The Attractor is a strong one, posited from the highs of 6/17, 7/14, and 7/29. That should act as support and the downward movement should stop at that area. We have a strong bull market going on, and at this juncture, nothing is going to stop it, short of an announcement of catastrophe.
RSI is at 52, which puts it square in the midrange, and it is headed down. If tomorrow moves down to the Attractor, that should take the pressure off the RSI and let move on down to about 40. That in turn will allow the bullishness to continue again from the bullish 40 range.
ATR is at about 100 points per day, so we could see all the clearing out done in one day, moving off of today's close at 9420.
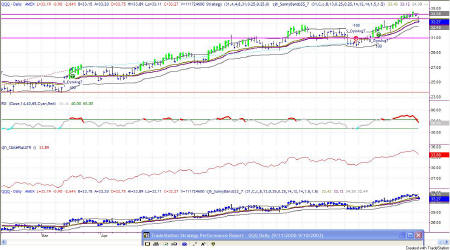
Figure 2a: QQQ Daily
LAST TIME I SAID: "The daily QQQ chart is still performing nicely, even though the RSI is in overbought territory, and could be a warning of a nearby correction to come. The QQQ has had a nice steady ride up for the past 9 or so weeks, but is at a bit of a steep angle, warning of (a) a blow-off to come or (b) a correction to come. I don't think the irrational exuberance is there yet for a blow off, so that leaves the possibility of a correction to bring the RSI down from the overbought territory. Keep playing the market with stops to take you in and stops to take you out."
And, today proved that to be the case.
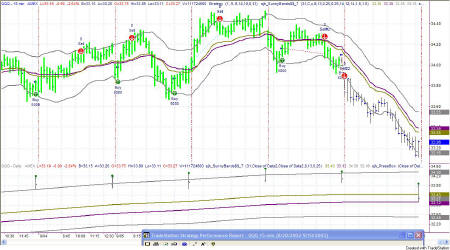
Figure 2b: QQQ 15-minute Intraday
The Attractor at 33.32 was the target for today, and is the Attractor I have been talking about for days, if not weeks. The downdraft today overshot the mark, moving on beyond the Attractor, but not by much, and not for long.
The last couple of bars for the day bounced back upward to test the Attractor from the other side.
RSI got as low as 20, and ended the day at 33, moving in the upward direction. There's no divergence, just a nice steady move down to the oversold area.
On the daily QQQ chart the next Attractor is lower, at 32.75, coinciding the the highs mentioned for the Dow. I think this support area will hold, if it even goes that low. The market has had a definite bullish flavor to it and the QQQ might not get as low as 32.75 in these next few sessions.
Watch out, though, because if it does break below 32.75 the next Attractor is down at 31.00! So, be prepared either way.

Figure 3a: EMini Intraday and Daily
LAST TIME I SAID: "The RSI now has a slight divergence in it, which could be warning us of a correction to come, so be careful and use tight stops."
And, today was just that correction! The morning started out kind of flat, but by midway through the session hints of downward motion were in place and the EMini began moving down. By my strategy we picked up a little profit and then got a signal to go long, which picked off just a little more profit, and then for the finale the system went short once more, closing out the position with a nice profit at the end of the day.
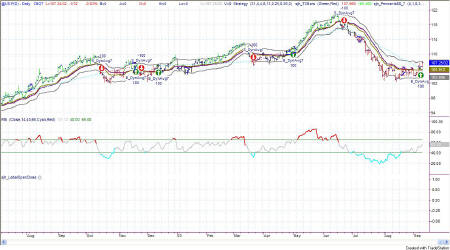
Figure 4a: US TBonds Daily
The suggestion from the commentary of the past week seem to be panning out! I was thinking that a rounded bottom was forming, and indeed, we now have a buy signal on the model.
Price is currently right on the Attractor at 107.97, so in all likelihood there should be some testing and retesting going on for the next several days to weeks. The market will want to see just how solid this Attractor is. Backing and filling is likely.
If the Attractor holds tight, and I think it will, the next step would be for price to head on upward to the next Attractor, which is at 112.80. Stops placed for protection could nicely be put at the SDMA (Sunny_Dynamic Moving Average) line which is currently right at 105.91.
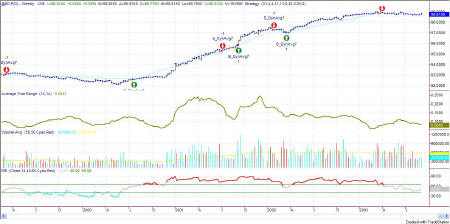
Figure 5a: EuroDollar Weekly
The long-term nature of trends in currencies
still has us short the Euro. Bit by bit it keeps drifting on downward,
but nothing in a hurry. In the general nature of currencies, this
trend is taking a long time to get established and a long time in the
trending.
This commentary is meant only for EDUCATIONAL PURPOSES. It is to help you see how a Technical Analyst reads the signs in the markets.
Stay sharp and on your toes. Moves can reverse on a dime, anytime. Let the market speak to you. If the market is going down, by golly ignore my commentary from the night before and know that the market is going down.
RULES OF THUMB:
0. I keep the chart in Figure 1a on each day's commentary simply to illustrate how much in tandem the 4 indexes I watch actually are. For this reason, I don't always comment on every index. Analysis of one speaks highly for the same analysis for each of the other indexes.
1. When price is pushing the upper Sunny_Bands upward and then eases off and moves back toward the midline, it's time to take profits. If it starts moving up and pushing on the Sunny_Bands again, it's time to get back in. Likewise, if the market is pushing down on the lower Sunny_Band and eases off to move back to the midline, it's time to take profits from the short play.
2. Divergence of the RSI and price is another good time to take profits and wait for a breakout of price before taking a position.
3. When the exchange puts in curbs or trading halts on a large move down, it usually (not always) stops the downward motion. After the market reopens is a good time to take profits from your short position.
4. The market can't go nowhere forever. Eventually, who knows how long it will be, there will have to be a breakout-- one direction or the other.
5. This commentary is for educational purposes only, and is meant only to teach readers about my indicators, other technical indicators, and how I read them.
==<:>==
While it may be true that a picture is worth a thousand words, it is definitely not true that a picture deserves a thousand words.