The Sunny Side of the Street
TECHNICAL ANALYSIS EDUCATION: EXPLAINED AND DECIPHERED FOR NEW AND
VETERAN TECHNICAL ANALYSTS ALIKE.
MONDAY EVENING -
Sept 15, 2003
Archives of Past
Commentaries . How Did We Do?
Weekend Stock Picks --
CLICK HERE
$44,893 in Stock Picks to date! Click Here to view.
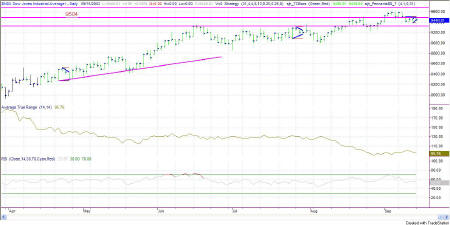
Figure 2a: Dow Industrials on a daily-minute basis
LAST TIME I SAID: Thus, let's expect an up day on Monday, hopefully breaking through overhead resistance which lies at the high of Friday. Wrong!
Today was a congestion and slightly down day.
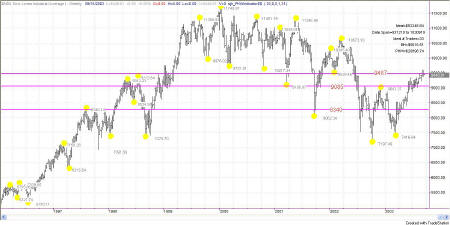
Taking a look at the broader forest, instead of getting bogged down in the trees, let's analyze the weekly chart of the Dow in Figure 2b.
You can see that the Attractor at 9487 is holding down prices at the moment. Another strong reason not to go on upward just now. Prices barriers like this are often tested for weeks before a break through, with the whipping and sawing going on until one side or the other gives up. The Dow chart still looks like one great big head-and-shoulders pattern, with the neckline coming in at just under 9000, at about 8700 or so. That would also be a 1/3 retracement of the previous upward move, and would make sense from that angle as well.
So, I think I've analyzed myself into a box. I don't really like what I came up with, because it mostly points down for a few weeks. But, if we are prepared, we can be shorting, if indeed that is what begins to take place.
What's your clue? Watch for the QQQ to break below 33.33 and the EMini to break below 1009.
Attractor: a level to which prices seem to be drawn, like a magnet. Usually these are lines of support or resistance from previous highs and lows, but can also be an important level on an indicator, or the edge of a Sunny_Band.
RSI: Relative Strength Index (TradeStation function)
SDMA: Sunny's Dynamic Moving Average (proprietary)
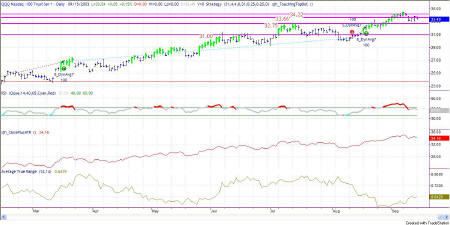
Figure 2a: QQQ - Daily Chart
Daily QQQs got stuck in a congestion pattern today, moving downward slowly, a whole 25cents. Whoopee. Today's movement almost, but not quite, canceled out yesterday's move up.
RSI on the daily chart is moving down slightly out of bullish territory, but is still strong. The ATR is at 64cents, and I am expecting a move of that size, whether in one direction or the other. Today's QQQ bar wrapped nicely around the Attractor at 33.66 and needs to choose a direction.
We had 9 weeks of stalemate sideways direction not too long ago, and I suppose we could do it again, but I hope not. That narrow range stuff ad infinitum does a trader in emotionally and financially.
I'm hoping for bonds to move on up past their Attractor, bringing interest rates down and giving equities room to move up some more.
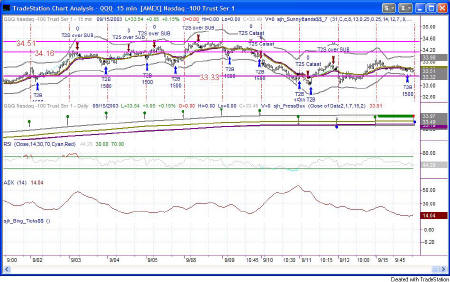
Figure 2b: QQQ 15-minute Intraday
My system, on the 15-min QQQ chart called for a open position holding overnight, suggesting tomorrow might be an up day.
If so, it will have to be a strong one to make it over the VERY strong resistance Attractor on the Weekly chart.
Take a look at this:
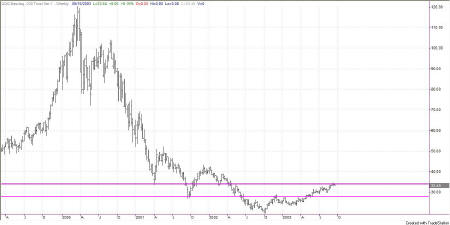
Figure 2c: Weekly chart of the QQQ
Prices on a weekly basis have been inching upward toward the Attractor at 34.15, which is just above current prices. Of course, we can expect to hit the 34.15 mark, but after that it can be tough going trying to blast through an Attractor as strong as that one.
Frankly, I'm afraid the more likely scenario is to churn for a while in the current range and then retest the Attractor below at 28.03. From there we should take a hearty bounce and retest the 34.15 line again, probably making it through the second time.
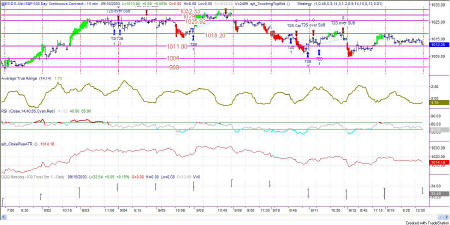
Figure 3a: EMini Intraday and Daily
LAST TIME I SAID: The next Attractor on the upside lies at about 1027, which is probably too far for a single day's run, as it is beyond 1 ATR from the current close. So, I'm expecting an up day, but only half way up to the next Attractor. Wrong!
Today was about as sideways as it gets on the EMini. Narrow range, no movement worth catching, and the only possibility is that getting into position at the end of the day might catch a gap tomorrow morning. My system position is currently long, and I am now skeptical about its worthiness for tomorrow's open. Too many weak days after a long run up makes one skeptical.
Keep the bonds in mind when looking at the equity charts. Bonds prices are at a major Attractor at the moment, and that is putting pressure on the equities indexes. The sun affects the magnetic pull as well as the moon. And likewise, other markets play a role in the movement of the markets we watch herein.
If bonds break down and can't make it above the 107.97 mark, then we know that bonds prices rising means interest rates are dropping, which then leads to equities markets rising...so if bonds break down we can look for rising interest rates, which is a poor environment for equities.
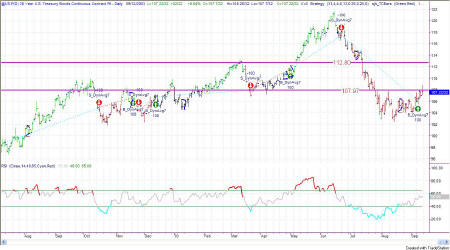
Figure 4a: US TBonds Daily
Bonds prices moved nicely above the Attractor on an intraday basis, but moved back down to the Attractor for the close.
The suggestion from the commentary of the past week seem to be panning out! I was thinking that a rounded bottom was forming, and indeed, we now have a buy signal on the model.
Price is currently right on the Attractor at 107.97, so in all likelihood there should be some testing and retesting going on for the next several days to weeks. The market will want to see just how solid this Attractor is. Backing and filling is likely.
If the Attractor holds tight, and I think it will, the next step would be for price to head on upward to the next Attractor, which is at 112.80. Stops placed for protection could nicely be put at the SDMA (Sunny_Dynamic Moving Average) line which is currently right at 105.91.
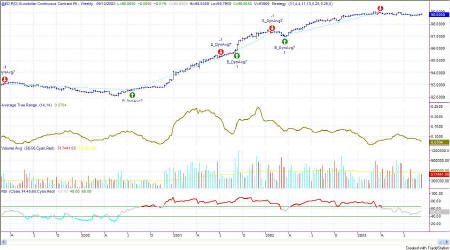
Figure 5a: EuroDollar Daily
The long-term nature of trends in currencies
still has us short the Euro. Bit by bit it keeps drifting on downward,
but nothing in a hurry. In the general nature of currencies, this
trend is taking a long time to get established and a long time in the
trending.
This commentary is meant only for EDUCATIONAL PURPOSES. It is to help you see how a Technical Analyst reads the signs in the markets.
Stay sharp and on your toes. Moves can reverse on a dime, anytime. Let the market speak to you. If the market is going down, by golly ignore my commentary from the night before and know that the market is going down.
RULES OF THUMB:
0. I keep the chart in Figure 1a on each day's commentary simply to illustrate how much in tandem the 4 indexes I watch actually are. For this reason, I don't always comment on every index. Analysis of one speaks highly for the same analysis for each of the other indexes.
1. When price is pushing the upper Sunny_Bands upward and then eases off and moves back toward the midline, it's time to take profits. If it starts moving up and pushing on the Sunny_Bands again, it's time to get back in. Likewise, if the market is pushing down on the lower Sunny_Band and eases off to move back to the midline, it's time to take profits from the short play.
2. Divergence of the RSI and price is another good time to take profits and wait for a breakout of price before taking a position.
3. When the exchange puts in curbs or trading halts on a large move down, it usually (not always) stops the downward motion. After the market reopens is a good time to take profits from your short position.
4. The market can't go nowhere forever. Eventually, who knows how long it will be, there will have to be a breakout-- one direction or the other.
5. This commentary is for educational purposes only, and is meant only to teach readers about my indicators, other technical indicators, and how I read them.
==<:>==
While it may be true that a picture is worth a thousand words, it is definitely not true that a picture deserves a thousand words.
