The Sunny Side of the Street
TECHNICAL ANALYSIS EDUCATION: EXPLAINED AND DECIPHERED FOR NEW AND
VETERAN TECHNICAL ANALYSTS ALIKE.
THURSDAY EVENING -
Sept 18, 2003
Archives of Past
Commentaries . How Did We Do?
Weekend Stock Picks --
CLICK HERE
$44,893 in Stock Picks to date! Click Here to view.
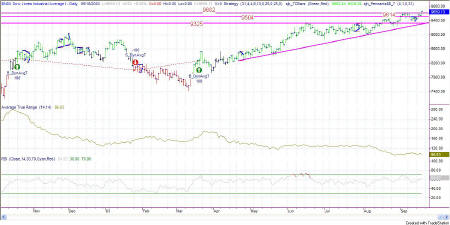
Figure 2a: Dow Industrials on a daily basis
The markets have broken through major resistance on all counts. The Dow is now above the 9614 level and headed for that all important 10,000 mark. That one is tough to break and will probably offer some resistance and a little hesitation. It is only 350 points away and will be big news when the breakthrough happens. Those big round numbers always act as roadblocks, so let's see what happens in the next few weeks.
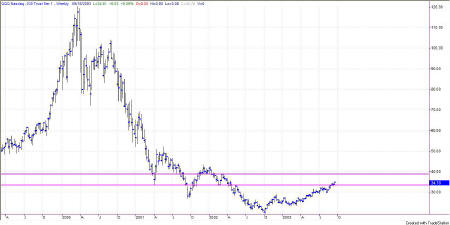
If bond prices continue to move upward, the market should follow and maybe even ignore the 10,000 as resistance. Keep in mind the forest. The long-term chart is telling:
We've come a long way, baby. And, for this to be exuberance we have a long way yet to go.
Attractor: a level to which prices seem to be drawn, like a magnet. Usually these are lines of support or resistance from previous highs and lows, but can also be an important level on an indicator, or the edge of a Sunny_Band.
RSI: Relative Strength Index (TradeStation function)
SDMA: Sunny's Dynamic Moving Average (proprietary)
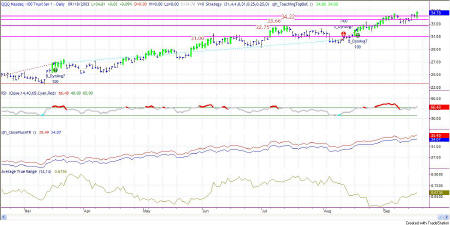
Figure 2a: QQQ - Daily Chart
RSI on the daily chart got a little relief yesterday making room for today's move upward. It was a strong enough move to pass through the 1.5ATR mark and continue on up to close at 34.77!
Now to see where we are related to the past, we have to go back to the daily chart, as far back as April 2002. From there we read that the major Attractor lies at 33.58, which is now below the current market level! Today's action broke right through it.
So, 33.58 is now the downside Attractor and the next level upward is at
38.84. Looks like we have some exciting weeks coming up, but they will
probably be climbing the wall of worry, inching their way up and correcting
downward every other day all the way up.
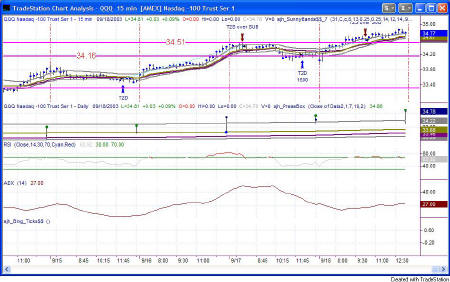
Figure 2b: QQQ 15-minute Intraday
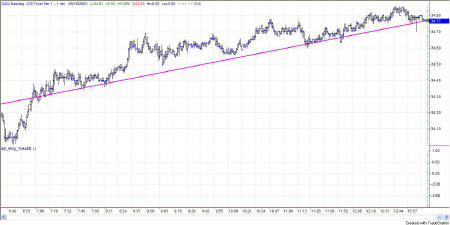
As you can see from Figure 2b, I was long coming into the day and held
until the first hesitation about noon. As soon as prices moved on up,
I re-entered which is where I remain overnight--holding long.
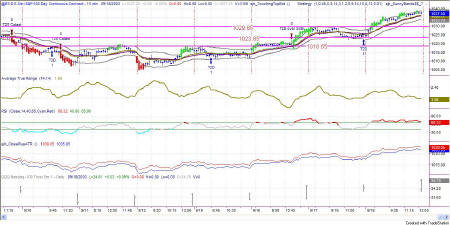
Figure 3a: EMini Intraday and Daily
RSI on the intraday chart is now back in higher territory, after having a day of relief. Today was primarily up at about a 45 degree angle, which is a very nice upward move.
It was a steady march right up and through the Attractors at 1027 and 1029.75, and now the next Attractor on the upside lies at 1045. The downside Attractors are now yesterday's upside Attractors: 1027 and 1029.75.
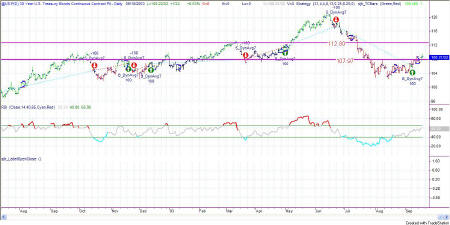
Figure 4a: US TBonds Daily
Another nicely up day for the bonds is good for the stock market, and today it showed. Dow up over 100 points! Now the US is out and above the Attractor so the trick is just to hold long positions with a 1.5ATR stop under price. But, if it breaks below the Attractor at 107.97 you can count me out.
Bonds moving up means interest rates moving down, as I've said before, which is good for the equities markets. Interest rates moving down usually means equity prices will rise. So, that's a good thing.
Watch closely and be wary incase the breakout shows itself to be false. Then if the profits begin to build, put a trailing stop under the ride up, 1.5 ATRs away from price.
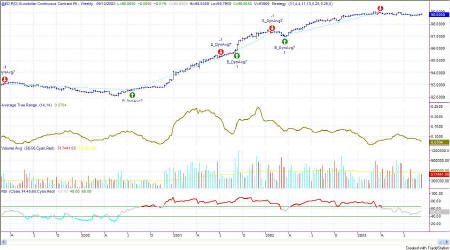
Figure 5a: EuroDollar Daily
The long-term nature of trends in currencies
still has us short the Euro. Bit by bit it keeps drifting on downward,
but nothing in a hurry. In the general nature of currencies, this
trend is taking a long time to get established and a long time in the
trending.
This commentary is meant only for EDUCATIONAL PURPOSES. It is to help you see how a Technical Analyst reads the signs in the markets.
Stay sharp and on your toes. Moves can reverse on a dime, anytime. Let the market speak to you. If the market is going down, by golly ignore my commentary from the night before and know that the market is going down.
RULES OF THUMB:
0. I keep the chart in Figure 1a on each day's commentary simply to illustrate how much in tandem the 4 indexes I watch actually are. For this reason, I don't always comment on every index. Analysis of one speaks highly for the same analysis for each of the other indexes.
1. When price is pushing the upper Sunny_Bands upward and then eases off and moves back toward the midline, it's time to take profits. If it starts moving up and pushing on the Sunny_Bands again, it's time to get back in. Likewise, if the market is pushing down on the lower Sunny_Band and eases off to move back to the midline, it's time to take profits from the short play.
2. Divergence of the RSI and price is another good time to take profits and wait for a breakout of price before taking a position.
3. When the exchange puts in curbs or trading halts on a large move down, it usually (not always) stops the downward motion. After the market reopens is a good time to take profits from your short position.
4. The market can't go nowhere forever. Eventually, who knows how long it will be, there will have to be a breakout-- one direction or the other.
5. This commentary is for educational purposes only, and is meant only to teach readers about my indicators, other technical indicators, and how I read them.
==<:>==
While it may be true that a picture is worth a thousand words, it is definitely not true that a picture deserves a thousand words.
