The Sunny Side of the Street
TECHNICAL ANALYSIS EDUCATION: EXPLAINED AND DECIPHERED FOR NEW AND
VETERAN TECHNICAL ANALYSTS ALIKE.
WEDNESDAY EVENING -
Sept 24, 2003
Archives of Past
Commentaries . How Did We Do?
Weekend Stock Picks --
CLICK HERE
CLICK HERE TO CHAT LIVE WITH SUNNY HARRIS DURING TRADING HOURS. This chat room is for Platinum Subscribers only!
$56,893 in Stock Picks to date! Click Here to view.
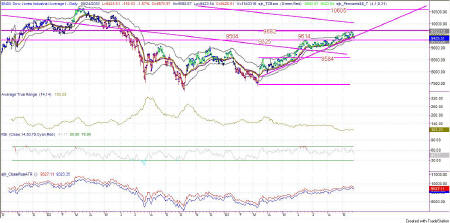
Figure 1a: Dow Industrials on a daily basis
Alright! Another day with direction! This time the other direction: down. Sure wasn't any "up-day" though, was it? Nevertheless, bonds went up again today, so I am still expecting up movement in the equities markets.
The lower Attractor on the daily chart, at 9325, pulled on the Dow all day, taking it down to a closing of 9425. It also took price below the upsloping trendline (on the weekly & daily charts). That would suggest that there is more to go on the downside, as the move to the Attractor is not yet complete.
On the weekly chart I also see a major Attractor at 9400, which is right about where today hit, and I've drawn it in Figure 1b. You can see that the Dow prices hit the 9400 line as resistance and as support all along the complex Head-and-Shoulders patter that keeps on keeping on.
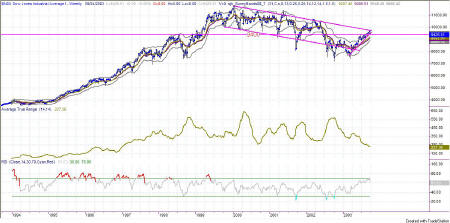
Figure 1b: Dow Weekly (linear scaling)
If you take just a little bit different view of the long-term chart and instead put the scaling on semi-log, the chart begins to look more like a rounded top that is being broken to the upside. Of course, on the long-term, we won't know for months yet whether that is the case.
But, from the long-term perspective, the Dow is still in the upper half of the Sunny_Bands (above the midline) and that speaks "bullish."
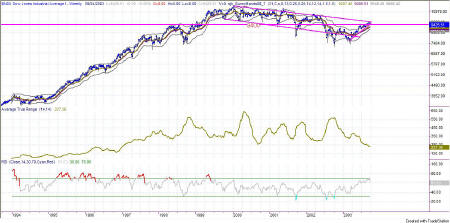
Figure 1c: Dow Weekly (semi-log scaling)
| Upper Band | Mid Band | Lower Band |
| 9723 | 9465 | 9310 |
| Upper Attractor | Lower Attractor | |
| 9682 | 9325 | |
| Close Plus ATR | Close Minus ATR | |
| 9527 | 9323 |
Attractor: a level to which prices seem to be drawn, like a magnet. Usually these are lines of support or resistance from previous highs and lows, but can also be an important level on an indicator, or the edge of a Sunny_Band.
RSI: Relative Strength Index (TradeStation function)
SDMA: Sunny's Dynamic Moving Average (proprietary)
Sunny_Band: Sunny's Dynamic Moving Average plus 1.5 ATR and minus 1.5 ATR, creating a band on either side of the SDMA.

Figure 2a: Daily QQQ
Today's downward reaction was every bit as directional as yesterday's up market. And, in fact, on the daily chart price moved past the Sunny_Band midline and into the lower half. That makes today the first day in the lower half since 8/13/03!
I still think the major Attractor above the current QQQs is at 41.77, but is still weeks away. In the meantime, there's nothing to do but follow the market. For instance, today when price broke below the lower Sunny_Band, I went short (fast!). So, no matter what any guru tells you the night before about the market's future direction, disregard it if the market tells you differently. I still think it is likely that we are going up, but between now and then we might see a correction that takes out half of the bull move that started 3/12/2003.
Always be on your toes, without an opinion as to market direction. The market will go where it goes and it is your job to dance backwards with your eyes closed. (from Trading 101)
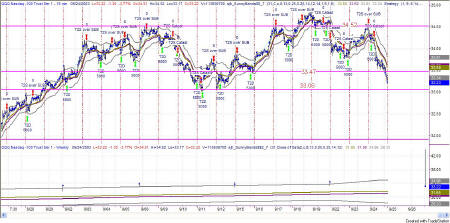
Figure 2b: QQQ 15-minute Intraday
I expect tomorrow to finish the drop to 33.06 on the QQQs, and take a bounce at the Attractor. But, that's not how I will trade. I will take my trades based on the movement of the market. If price stays below the midline of the Sunny_Bands I will stay short; if price rises above the midline I will get out of my short position and go long. By following that simple system of rules, it takes the guesswork out and throws away the opinion. That way I am relying on my backtesting and trusting that the future will behave similarly to the past. Can that fail? Sure. We can move out of this 3-year bear market that has provided lots of periods of sideways movement and into a trending bull market. Then I will resort back to trading the longer term SDMA.
| Upper Band | Mid Band | Lower Band |
| 33.81 | 33.58 | 33.34 |
| Upper Attractor | Lower Attractor | |
| 36.66 | 33.06 | |
| Close Plus ATR | Close Minus ATR | |
| 33.98 | 32.46 |
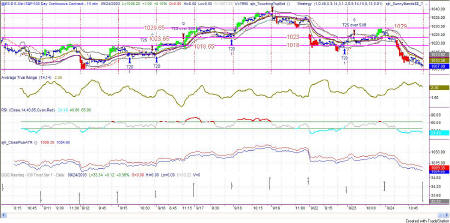
Figure 3a: EMini Intraday and Daily
Wrong all the way around on the predictions. But, as I said above, to heck with predictions, when price breaks an Attractors, or when price breaks a Sunny_Band, trade in that direction until it doesn't any more. You can clearly see on the chart above where the bars are painted red. That was done by a PaintBar study based on my Sunny_Bands, and as you can see it caught most of the move down. Even though I didn't get out when the bars quit being red, and I may regret it in the morning, I did so (stayed short) because the market continued to move down. Remember the adage: Let your profits ride.
| Upper Band | Mid Band | Lower Band |
| 1033.67 | 1015.37 | 997.08 |
| Upper Attractor | Lower Attractor | |
| 1050 | 954 | |
| Close Plus ATR | Close Minus ATR | |
| 1019.63 | 994.88 |
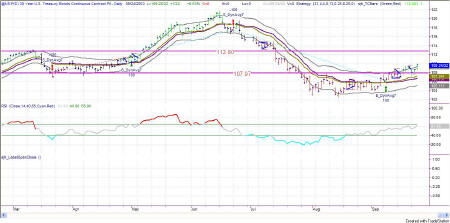
Figure 4a: US TBonds Daily
The US rose again today, playing with the Attractor at 107.97. It is a major Attractor and so the market could play with support and resistance several more times before it chooses a direction and heads in that clearly direction.
Prices are in the upper half of the Sunny_Bands, which is bullish, and are beginning to play with the upper band itself, which can be quite bullish. In fact, usually when markets are doing really well I see price ride the top band for days or weeks at a time.
Watch closely and be wary incase the breakout shows itself to be false. Then if the profits begin to build, put a trailing stop under the ride up, 1.5 ATRs away from price.
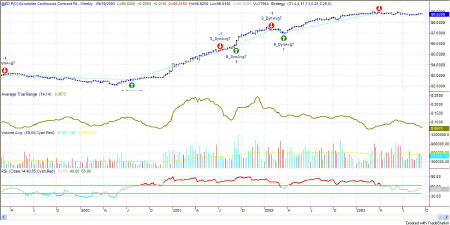
Figure 5a: EuroDollar Daily
The long-term nature of trends in currencies
still has us short the Euro. Bit by bit it keeps drifting on downward,
but nothing in a hurry. In the general nature of currencies, this
trend is taking a long time to get established and a long time in the
trending.
This commentary is meant only for EDUCATIONAL PURPOSES. It is to help you see how a Technical Analyst reads the signs in the markets.
Stay sharp and on your toes. Moves can reverse on a dime, anytime. Let the market speak to you. If the market is going down, by golly ignore my commentary from the night before and know that the market is going down.
RULES OF THUMB:
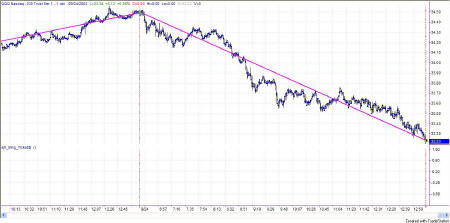
0. I keep the chart in Figure 1a on each day's commentary simply to illustrate how much in tandem the 4 indexes I watch actually are. For this reason, I don't always comment on every index. Analysis of one speaks highly for the same analysis for each of the other indexes.
1. When price is pushing the upper Sunny_Bands upward and then eases off and moves back toward the midline, it's time to take profits. If it starts moving up and pushing on the Sunny_Bands again, it's time to get back in. Likewise, if the market is pushing down on the lower Sunny_Band and eases off to move back to the midline, it's time to take profits from the short play.
2. Divergence of the RSI and price is another good time to take profits and wait for a breakout of price before taking a position.
3. When the exchange puts in curbs or trading halts on a large move down, it usually (not always) stops the downward motion. After the market reopens is a good time to take profits from your short position.
4. The market can't go nowhere forever. Eventually, who knows how long it will be, there will have to be a breakout-- one direction or the other.
5. This commentary is for educational purposes only, and is meant only to teach readers about my indicators, other technical indicators, and how I read them.
==<:>==
While it may be true that a picture is worth a thousand words, it is definitely not true that a picture deserves a thousand words.
