The Sunny Side of the Street
TECHNICAL ANALYSIS EDUCATION: EXPLAINED AND DECIPHERED FOR NEW AND
VETERAN TECHNICAL ANALYSTS ALIKE.
THURSDAY EVENING -
Sept 25, 2003
Archives of Past
Commentaries . How Did We Do?
Weekend Stock Picks --
CLICK HERE
CLICK HERE TO CHAT LIVE WITH SUNNY HARRIS DURING TRADING HOURS. This chat room is for Platinum Subscribers only!
$56,893 in Stock Picks to date! Click Here to view.
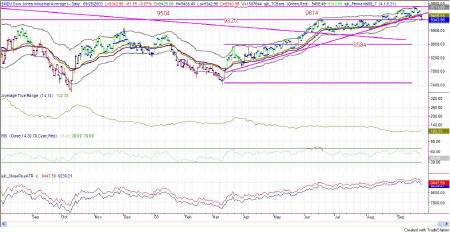
Figure 1a: Dow Industrials on a daily basis
The lower Attractor on the daily chart, at 9325, pulled on the Dow all day, taking it nearly down to that level, closing at 9343. Bonds had another up day, however, which doesn't explain the reaction in the equities markets.
Tomorrow the Attractor at 9325 will exert more downward pressure on the market, with the longer range Attractor being down at the 9000 level. Half of the move up would retrace to 8584, which still looms underneath it all, pulling.
| Upper Band | Mid Band | Lower Band |
| 97211.94 | 9456 | 9302 |
| Upper Attractor | Lower Attractor | |
| 9682 | 9325 | |
| Close Plus ATR | Close Minus ATR | |
| 9448 | 9239 |
Attractor: a level to which prices seem to be drawn, like a magnet. Usually these are lines of support or resistance from previous highs and lows, but can also be an important level on an indicator, or the edge of a Sunny_Band.
RSI: Relative Strength Index (TradeStation function)
SDMA: Sunny's Dynamic Moving Average (proprietary)
Sunny_Band: Sunny's Dynamic Moving Average plus 1.5 ATR and minus 1.5 ATR, creating a band on either side of the SDMA.
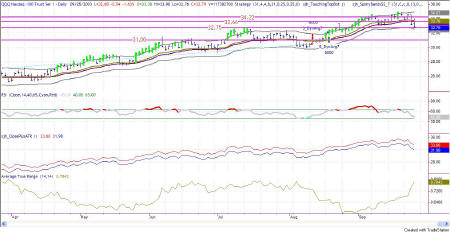
Figure 2a: Daily QQQ
Today's downward reaction was every bit as directional as yesterday's up market. And, in fact, on the daily chart price moved past the Sunny_Band midline and into the lower half. That makes today the first day in the lower half since 8/13/03!
I still think the major Attractor above the current QQQs is at 41.77, but is still weeks away. In the meantime, there's nothing to do but follow the market. For instance, today when price broke below the lower Sunny_Band, I went short (fast!). So, no matter what any guru tells you the night before about the market's future direction, disregard it if the market tells you differently. I still think it is likely that we are going up, but between now and then we might see a correction that takes out half of the bull move that started 3/12/2003.
Always be on your toes, without an opinion as to market direction. The market will go where it goes and it is your job to dance backwards with your eyes closed. (from Trading 101)
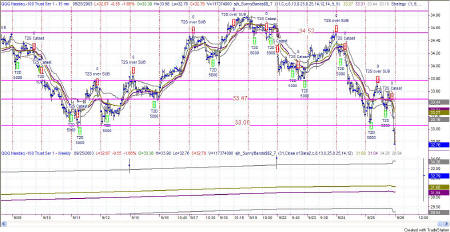
Figure 2b: QQQ 15-minute Intraday
LAST TIME I SAID: "I expect tomorrow to finish the drop to 33.06 on the QQQs, and take a bounce at the Attractor." Prices on the QQQ did just that on the 15-minute chart. At 7:30am and 7:45am the bar bounced right off of the 33.06 level and moved back upward until the high at 9:30am, passing through the 33.66 Attractor.
As price hit the upper Sunny_Band it promptly turned around, hesitated for two bars at the 33.66 Attractor and then dropped to the 33.32 Attractor. From there it took a bounce right back up to the 33.63 mark and then cascaded down past the lowest Attractor I had called out, and nearly made it down to the next level, which is at 32.50.
The likelihood is for tomorrow to finish the drop to 32.50, and take a bounce upward from there, probably giving us another sideways day to suffer through.
| Upper Band | Mid Band | Lower Band |
| 33.55 | 33.27 | 32.99 |
| Upper Attractor | Lower Attractor | |
| 33.06 | 32.50 | |
| Close Plus ATR | Close Minus ATR | |
| 32.95 | 32.57 |
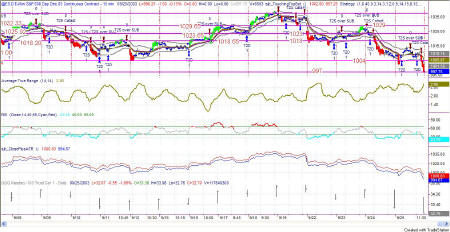
Figure 3a: EMini Intraday and Daily
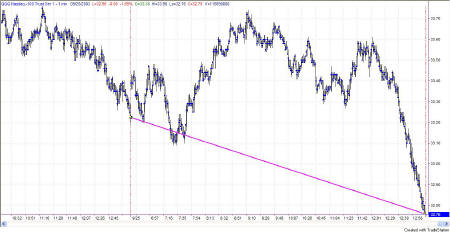
Today's EMini headed straight for the Attractor at 997 which I had drawn on yesterday's chart, and which coincided with the lower Sunny_Bands. It was a great day for shorting. I also picked off a quick long trade today as the market bounced off of the first Attractor, and then went short after it touched the old familiar Attractor at 33.63 on the QQQs. That number has come up frequently over the last several months, and is therefore a significant line of resistance.
After the low today near 997, what's next? The next lower Attractor lies at 989, and the next upper Attractor would be to bounce back up to 1004. The table below shows the major Attractors that lie out beyond that.
Often the market will have a cascading follow-through on a day with a sharp down period like today, but lately it hasn't been the case. In this funny sideways dance the markets are now doing, a sharp downdraft is often followed by a bounce back up, and then another move down.
So, I'll be looking for shorts if it breaks below 997 and longs if it bounces off 997 and starts up. Keep in mind that the ATR is about 12 points, so don't expect more than that.
| Upper Band | Mid Band | Lower Band |
| 1032.86 | 1013.97 | 997.75 |
| Upper Attractor | Lower Attractor | |
| 1050 | 954 | |
| Close Plus ATR | Close Minus ATR | |
| 1010.93 | 984.58 |
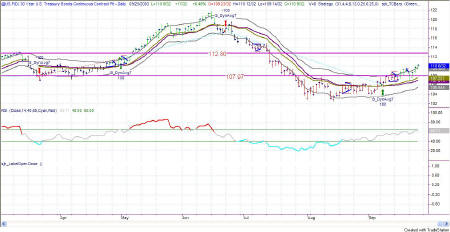
Figure 4a: US TBonds Daily
The US rose again today, now safely above the Attractor at 107.97. I use the Sunny_Bands to exit when price once again touches the midline, and hopefully there will be plenty of profit built up in the model before it turns around.
Prices are above the upper half of the Sunny_Bands, which is very bullish. RSI on the US is in the bullish range, but not overbought, so it looks like bonds have more to go on the upside.
Watch closely and be wary incase the breakout shows itself to be false. Then if the profits begin to build, put a trailing stop under the ride up, 1.5 ATRs away from price.
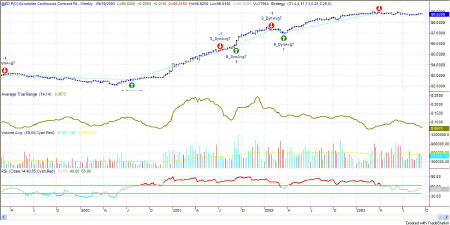
Figure 5a: EuroDollar Daily
The long-term nature of trends in currencies
still has us short the Euro. Bit by bit it keeps drifting on downward,
but nothing in a hurry. In the general nature of currencies, this
trend is taking a long time to get established and a long time in the
trending.
This commentary is meant only for EDUCATIONAL PURPOSES. It is to help you see how a Technical Analyst reads the signs in the markets.
Stay sharp and on your toes. Moves can reverse on a dime, anytime. Let the market speak to you. If the market is going down, by golly ignore my commentary from the night before and know that the market is going down.
RULES OF THUMB:
0. I keep the chart in Figure 1a on each day's commentary simply to illustrate how much in tandem the 4 indexes I watch actually are. For this reason, I don't always comment on every index. Analysis of one speaks highly for the same analysis for each of the other indexes.
1. When price is pushing the upper Sunny_Bands upward and then eases off and moves back toward the midline, it's time to take profits. If it starts moving up and pushing on the Sunny_Bands again, it's time to get back in. Likewise, if the market is pushing down on the lower Sunny_Band and eases off to move back to the midline, it's time to take profits from the short play.
2. Divergence of the RSI and price is another good time to take profits and wait for a breakout of price before taking a position.
3. When the exchange puts in curbs or trading halts on a large move down, it usually (not always) stops the downward motion. After the market reopens is a good time to take profits from your short position.
4. The market can't go nowhere forever. Eventually, who knows how long it will be, there will have to be a breakout-- one direction or the other.
5. This commentary is for educational purposes only, and is meant only to teach readers about my indicators, other technical indicators, and how I read them.
==<:>==
While it may be true that a picture is worth a thousand words, it is definitely not true that a picture deserves a thousand words.
