The Sunny Side of the Street
TECHNICAL ANALYSIS EDUCATION: EXPLAINED AND DECIPHERED FOR NEW AND
VETERAN TECHNICAL ANALYSTS ALIKE.
TUESDAY EVENING -
Sept 30, 2003
Archives of Past
Commentaries . How Did We Do?
Weekend Stock Picks --
CLICK HERE
CLICK HERE TO CHAT LIVE WITH SUNNY HARRIS DURING TRADING HOURS. This chat room is for Platinum Subscribers only!
$56,893 in Stock Picks to date! Click Here to view.
Lately it seems like an every other day dance: one day up followed by one day down. And it is beginning to pan out to look more and more like the 50% retracement of the move up since March. If we get that low, the number is 8578. I have drawn an Attractor at 8948 which is the number I think is more likely to be hit. Not quite a full retracement, but close enough. But, the stock market doesn't go anywhere in a straight line, so I'm expecting lots more back and forthing.
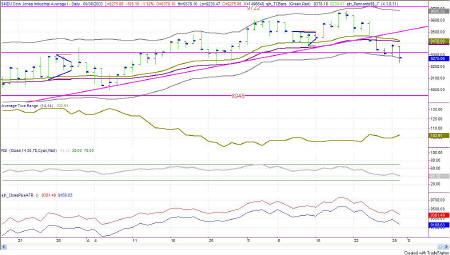
Figure 1c: Dow Industrials Daily Basis
| Upper Band | Mid Band | Lower Band |
| 9685 | 9428 | 9275 |
| Upper Attractor | Lower Attractor | |
| 9722 | 8948 | |
| Close Plus ATR | Close Minus ATR | |
| 9381 | 9168 |
Attractor: a level to which prices seem to be drawn, like a magnet. Usually these are lines of support or resistance from previous highs and lows, but can also be an important level on an indicator, or the edge of a Sunny_Band.
RSI: Relative Strength Index (TradeStation function)
SDMA: Sunny's Dynamic Moving Average (proprietary)
Sunny_Band: Sunny's Dynamic Moving Average plus 1.5 ATR and minus 1.5 ATR, creating a band on either side of the SDMA.
Today's action can only be described as sideways, even though there were several quick opportunities for longs and shorts both. The reason I say sideways, is because unless you had a crystal ball, it was next to impossible to catch the lightning fast moves up and down, before the day turned into a sideways day.
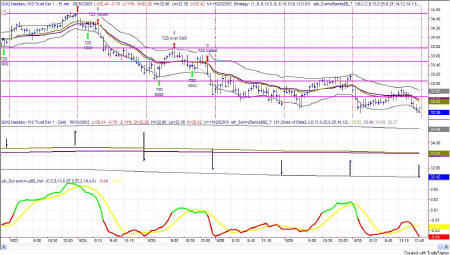
Figure 2b: QQQ 15-minute Intraday
LAST TIME I SAID: "My tendency is to say we are in for a 50% correction of the recent bull move, but something is telling me that is too cavalier. The longer-term view on my Dynamic Moving Average is still bullish and is not ready to be refuted. So, with everyone talking about the impending correction, maybe it just won't happen." And, yet today was another down day after an up day yesterday. Lots of choppiness going on. We are no where near the 50% retracement yet, which would take the QQQs to 27.24, but it is beginning to look like that's what's happening.
The RSI is still topping out above the 60 range, which says to me we are still in bullish mode. Until it goes lower than 40, I'm not going to be totally convinced it is a true retracement going on. Nevertheless, stops for entries above and below the market, and close profit stops for exits is how I'm playing it these days.
| Upper Band | Mid Band | Lower Band |
| 34.68 | 33.52 | 32.42 |
| Upper Attractor | Lower Attractor | |
| 33.63 | 31.87 | |
| Close Plus ATR | Close Minus ATR | |
| 33.20 | 31.64 |
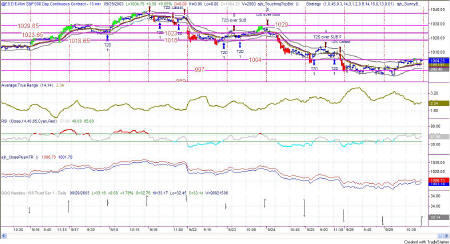
Figure 3a: EMini Intraday and Daily
The longer term scenario is now in bearish territory, telling me to only take the short trades at the moment. I don't know whether it will make it to the 50% retracement (911), but it is beginning to look like it will make it to the lower Attractor at 954.
| Upper Band | Mid Band | Lower Band |
| 1029 | 1010 | 994 |
| Upper Attractor | Lower Attractor | |
| 1050 | 954 | |
| Close Plus ATR | Close Minus ATR | |
| 1007 | 980 |
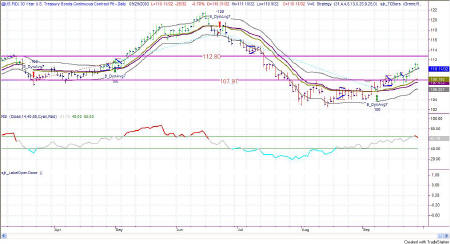
Figure 4a: US TBonds Daily
The US is still safely above the Attractor at 107.97, but today's intraday movement was downward.
The Attractor above the market at 112.80 is still calling, edging the US upward, and the market is now about half way between that Attractor and the lower one at 107.97.
My bet is that it will make it to the 112 mark, but I'd be safe putting a rising stop under the current market to capture profits if the market decides to take a turn for the worse at any time. At present, a stop of the upper band would be too close, but just a little bit beyond that makes sense.
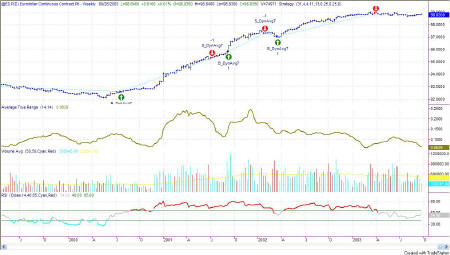
Figure 5a: EuroDollar Daily
The long-term nature of trends in currencies
still has us short the Euro. Bit by bit it keeps drifting on downward,
but nothing in a hurry. In the general nature of currencies, this
trend is taking a long time to get established and a long time in the
trending.
This commentary is meant only for EDUCATIONAL PURPOSES. It is to help you see how a Technical Analyst reads the signs in the markets.
Stay sharp and on your toes. Moves can reverse on a dime, anytime. Let the market speak to you. If the market is going down, by golly ignore my commentary from the night before and know that the market is going down.
RULES OF THUMB:
0. I keep the chart in Figure 1a on each day's commentary simply to illustrate how much in tandem the 4 indexes I watch actually are. For this reason, I don't always comment on every index. Analysis of one speaks highly for the same analysis for each of the other indexes.
1. When price is pushing the upper Sunny_Bands upward and then eases off and moves back toward the midline, it's time to take profits. If it starts moving up and pushing on the Sunny_Bands again, it's time to get back in. Likewise, if the market is pushing down on the lower Sunny_Band and eases off to move back to the midline, it's time to take profits from the short play.
2. Divergence of the RSI and price is another good time to take profits and wait for a breakout of price before taking a position.
3. When the exchange puts in curbs or trading halts on a large move down, it usually (not always) stops the downward motion. After the market reopens is a good time to take profits from your short position.
4. The market can't go nowhere forever. Eventually, who knows how long it will be, there will have to be a breakout-- one direction or the other.
5. This commentary is for educational purposes only, and is meant only to teach readers about my indicators, other technical indicators, and how I read them.
==<:>==
While it may be true that a picture is worth a thousand words, it is definitely not true that a picture deserves a thousand words.
