The Sunny Side of the Street
TECHNICAL ANALYSIS EDUCATION: EXPLAINED AND DECIPHERED FOR NEW AND
VETERAN TECHNICAL ANALYSTS ALIKE.
WEDNESDAY EVENING -
Oct 01, 2003
Archives of Past
Commentaries . How Did We Do?
Weekend Stock Picks --
CLICK HERE
Looks like no one was interested in real-time chatting, so I've removed the link. Anyone interested in posting comments or questions to the bulletin board (not real-time) may click here.
I am conducting two seminars in January, if enough interest is shown. The seminars are intense workshops in which we not only follow a strict and intense agenda, but in which we take your specific questions and problems and work them into the content of the workshop. You send me your issues well in advance of the seminar and I tailor the discussions to address your issues. Only 15 people are allowed to come, and you'll be pleasantly surprised how much we cover in depth.
$56,893 in Stock Picks to date! Click Here to view.
LAST TIME I SAID: "Lately it seems like an every other day dance: one day up followed by one day down." And that's what it did again today. Yesterday was a nice down day, and today was a nice directional up day. So, does that mean that tomorrow is going to be a down day? Well let's look at the bigger picture first and then move down into the faster charts.
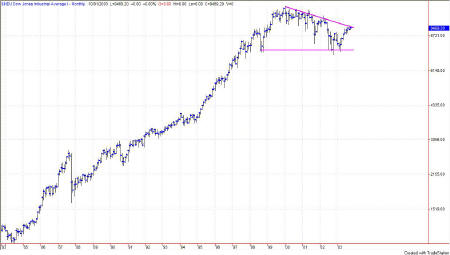
Figure 1b: Dow Industrials Monthly Basis
The monthly chart of the Dow shows us a clear up move that began in March of 2003. We have stayed generally on that upward path for seven months now. The coming month of October will be very telling for the stock market in general, not only because it has the superstition of being the month in which crashes occur, but for other reasons as well.
On the chart above (semi-log scaling), labeled 1b you can readily see that the downsloping trendline has been hit, but not yet broken. The two trendlines taken together and looking at the bigger picture, form a technical pattern known as an Ascending Triangle. Generally technicians interpret this pattern as a consolidation pattern, and one which, in this configuration, is resolved to the upside.
So, we have a pattern that is near-term negative, and long-term positive. I say that because if this pattern plays to its general nature, we are due for a correction down to the area of the horizontal line. That's the negative part. And, the horizontal line lies at 7566 on the Dow.
The QQQs don't go back far enough historically for us to view the same chart, so let's look at something else for comparison.
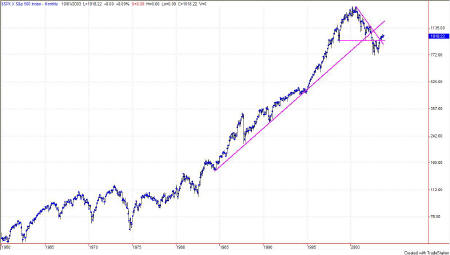
Figure 1c: S&P 500 Monthly chart
In Figure 1c we have a chart of the S&P 500 (semi-log scaling) on a monthly basis, again so we can look at the very long-term. Here too, we have a pennant, or ascending triangle, but this time it is already resolved, but it broke down out of the formation and has now worked its way back above the horizontal line--again since March of 2003.
One scenario for this chart configuration's resolution would be for the market to continue moving upward until it meets with the long-term upsloping trendline (also known as the staff of the flag, or flagpole.) Another scenario would be for the market to come back down to the horizontal line and chop around there for a while, creating a base from which to launch a second bull run. Another scenario would be for the market to continue down a bit more until the resolution of the Head-and-Shoulders pattern which is also evident in Figure 1c. That would be ugly, taking the S&P down to about 575.
The NASDAQ index goes back to 1990, which is not far enough to get the real picture as we did in the other two charts, extending back to 1983 and 1960 respectively. But, let's take a look at the NASDAQ anyway.
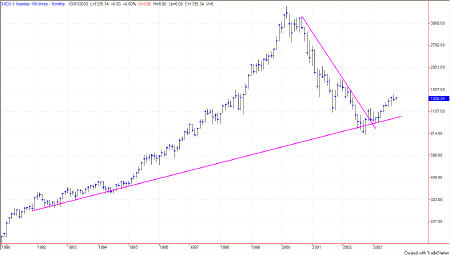
Figure 1d: NASDAQ Monthly chart back to 1990
Again on semi-log scaling (if any of you don't understand this scaling, or its benefits, please give me a call and I'll make it easy for you. (760) 930-1050. during trading hours, please.)
Here we see a long-term uptrend, not as steep as the others, but which got circumvented in 1995 by unbridled enthusiasm and took off steeply above the general trend. The trend was sharp, and the resulting reversal was also sharp, taking away the standard 50% of the move up, before resuming on its original path. You can see that we are now back on the original trendline.
The most likely event now would be for the NASDAQ to come back down to the trendline and resume cyclical trading marching upward along that trendline.
I would like to continue this discussion tomorrow night by looking at the weekly charts, but for now let's get right down to today's activity and tomorrow's likelihoods.
One of your comrades showed me a 3-minute chart of the EMini tonight. Here's what we discussed (I think it will benefit all):
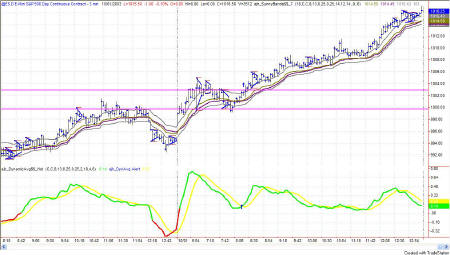
Figure 1e: 3 minute EMini with Sunny_Bands, SDMA Histogram and Pennants.
The lower indicator (red, green and yellow) showed a buy signal at the end of the day yesterday. At that point there was also a pennant, telling us to wait for the breakout point on the pennant before entering. Price was below the midline of the Sunny_Bands, but not below the lower band itself, showing the turn from bearishness to bullishness, but not yet with much strength in it. On the open this morning the market gapped up, above any beyond the upper Sunny_Band. If you hadn't gone long already, this was the time. Great show of strength by passing the upper Sunny_Band.
The ES formed two pennants by 7:27 and at 7:33 closed beneath the 2nd pennant's lower line, indicating a stop out of the long position. Further, the top Sunny_Band had been violated on a closing basis and the midline had been touched.
So there's the first trade, with a small profit. Now, if you are a scalper and like to trade fast, you would have taken profits near the high at 7:06, when the second pennant formed lower than the first. That would have taken you out at 7:30am, at about 1002.19. Your entry would have been 998.97. Not a bad little trade there for first thing in the morning.
Next information coming at us is the first close within the Sunny_Bands at 7:30, which can be construed as a reason to go short, especially since it breaks the lower pennant line. At 8:00 price closes below the lower Sunny_Band and then two bars later closes within the band. Time to get out of the short. You would have shorted at 1002.25 and closed out at 1000.75. Another nice little trade.
At 8:27 you would go long because price closed above the upper Sunny_Band and at the same time broke above the current pennant, getting you long at 1003.25. For the rest of the day price goes upward and stays above the Sunny_Bands midline, with no closes under the midline. Furthermore, no prices penetrate the lows of any of the subsequent pennants and we are still long at the end of the day, at 1016.25. If you're a daytrader, you exit. If not, and if you're brave, you hold overnight.
And that's how I use my indicators.
On the daily chart of the ES, today closed back within the Sunny_Bands and in fact above the midline. That's a bullish signal for tomorrow. On closes like that we often see the close of the next day move the the outer band, either upper or lower. So, the upper band lies at 1023.13 and the lower band at 1002.61. But, intraday you read the bands, SDMA histogram and pennants all together for a cohesive plan.
Attractor: a level to which prices seem to be drawn, like a magnet. Usually these are lines of support or resistance from previous highs and lows, but can also be an important level on an indicator, or the edge of a Sunny_Band.
RSI: Relative Strength Index (TradeStation function)
SDMA: Sunny's Dynamic Moving Average (proprietary)
Sunny_Band: Sunny's Dynamic Moving Average plus 1.5 ATR and minus 1.5 ATR, creating a band on either side of the SDMA.
This commentary is meant only for EDUCATIONAL PURPOSES. It is to help you see how a Technical Analyst reads the signs in the markets.
Stay sharp and on your toes. Moves can reverse on a dime, anytime. Let the market speak to you. If the market is going down, by golly ignore my commentary from the night before and know that the market is going down.
RULES OF THUMB:
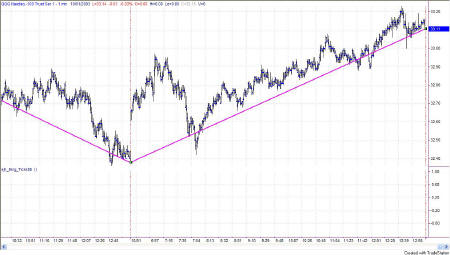
0. I keep the chart in Figure 1a on each day's commentary simply to illustrate how much in tandem the 4 indexes I watch actually are. For this reason, I don't always comment on every index. Analysis of one speaks highly for the same analysis for each of the other indexes.
1. When price is pushing the upper Sunny_Bands upward and then eases off and moves back toward the midline, it's time to take profits. If it starts moving up and pushing on the Sunny_Bands again, it's time to get back in. Likewise, if the market is pushing down on the lower Sunny_Band and eases off to move back to the midline, it's time to take profits from the short play.
2. Divergence of the RSI and price is another good time to take profits and wait for a breakout of price before taking a position.
3. When the exchange puts in curbs or trading halts on a large move down, it usually (not always) stops the downward motion. After the market reopens is a good time to take profits from your short position.
4. The market can't go nowhere forever. Eventually, who knows how long it will be, there will have to be a breakout-- one direction or the other.
5. This commentary is for educational purposes only, and is meant only to teach readers about my indicators, other technical indicators, and how I read them.
==<:>==
While it may be true that a picture is worth a thousand words, it is definitely not true that a picture deserves a thousand words.
