The Sunny Side of the Street
TECHNICAL ANALYSIS EDUCATION: EXPLAINED AND DECIPHERED FOR NEW AND
VETERAN TECHNICAL ANALYSTS ALIKE.
SUNDAY EVENING -
Oct 05, 2003
Archives of Past
Commentaries . How Did We Do?
Weekend Stock Picks --
CLICK HERE
Anyone interested in posting comments or questions to the bulletin board may click here. Sunny personally answers each question or comment posted.
I am conducting two seminars in January, if enough interest is shown. The seminars are intense workshops in which we not only follow a strict and intense agenda, but in which we take your specific questions and problems and work them into the content of the workshop. You send me your issues well in advance of the seminar and I tailor the discussions to address your issues. Only 15 people are allowed to come, and you'll be pleasantly surprised how much we cover in-depth. Click Here to view the agendas of the seminars.
$56,893 in Stock Picks to date! Click Here to view.
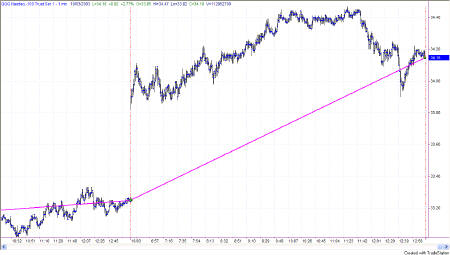
A beautiful up-day on Friday! Huge opening gap with continued follow-through, only to end the day by retracing much of the move (excluding the gap) by the end of the day. So, unless you were long from the day before, it was another difficult day to
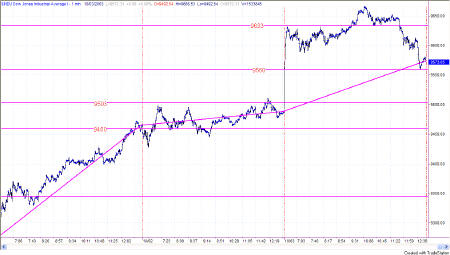
trade. The Dow was even more difficult, retracing part of the gap at the end of the day.
Again the Dow pretty much played within the two horizontal lines I had drawn the day before, this time at 9633 and 9560. It's amazing how that happens, with price going right back to lines of support and resistance that it has set up previously, sometimes even quite some time ago.
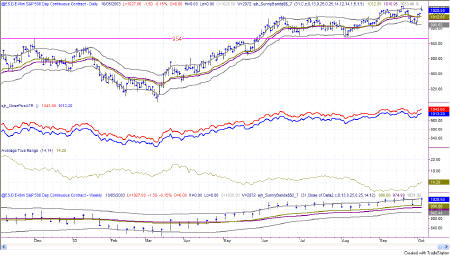
Last time I said I thought the EMini would strive for 1031, which at the time was the upper band. The opening gap, plus the rest of the day's move, put the EMini right on top of the current Sunny_Band! That's another nice bullish signal. Now we have the weekly and the daily prices both in the upper half of the Sunny_Bands, but at the same time fighting the previous high of 1038.50 which occurred on 9/18. Friday's close was at 1028.50, but the high of the day was at 1038.00 even. That will possibly set a trip wire for Monday. If it doesn't get tripped, the next Attractor on the up side is at 1050 and it looks like some smooth sailing up to that level.
Last time we examined the weekly charts for the overall view. Tonight I'm going to take a look at what we can see technically on the daily charts.
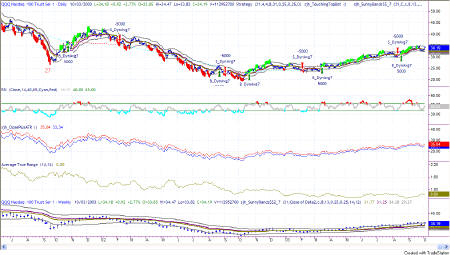
Again, I'll examine the QQQs. The prices have held steadily above the weekly Sunny_Band (in the bottom subgraph) since March 17th, 2003. That has been strongly bullish all along. And, the SDMA has also held above the slow SDMA for all but a little segment of the time (from 8/22 - 8/19) where it tried to go short. While we would have exited the long position just previous to that as it passed through the midline SDMA, or even could have waited until it passed through the bottom line, we would not have gone short as price didn't get lower than the low of the signal bar. The reentry signal came on 8/15 as price closed back above the midline of the SDMA in the Sunny_Bands. We would have held long until 9/24 when price once again crossed below the midline, which was the time to exit and take profits, if any. Prices then held below the midline until Friday, when it closed once again above the midline into bullish territory. Thus, if Monday's prices are higher than Friday's highs, I'll be long again.
RSI touched down near the 40 line without cutting below it, which again is bullish, and has been crossing above the 65 line when the QQQs are running upward. This is very bullish.
Average True Range is about 80 cents a day, which on 5000 shares would come to $4,000 per day.
Let's look at Interest Rates. the EuroDollar and Gold briefly.
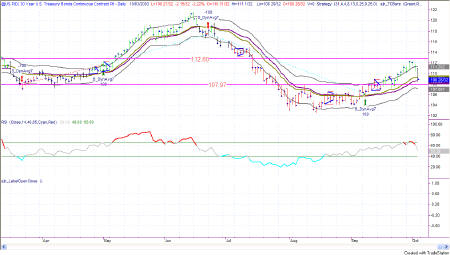
Friday's upswing in the Equities markets was accompanied by a down draft in the Bonds. That's not good news. We want them in synch with each other, so that as interest rates go down, equities go up.
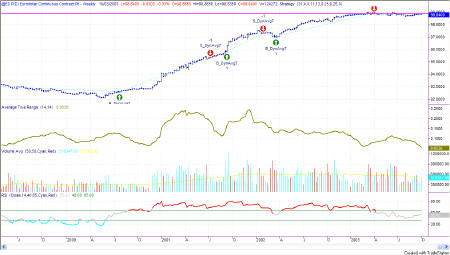
The EuroDollar has been hanging out at about the same price since the short signal in April, not losing money and not producing any profits either. They say that currencies trend, and I guess straight sideways is a trend. But, I prefer a trend with a direction to it for a little excitement.
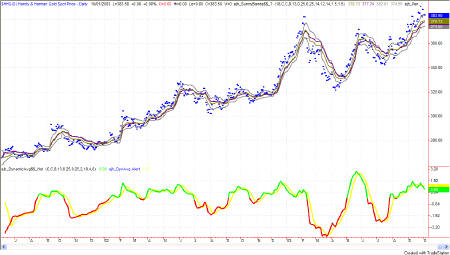
Gold has progressed steadily upward from its 270 level in June 2001 to the current price of 383. Of course, it has gone up and down getting there, but if you draw a line from start to finish, it is definitely a steady upward line. Because of the sinusoidal swings, it looks like gold is in for another down swing in the near future. In the past, rising gold prices meant rising interest rates, which has not held true this time. Perhaps gold has become a commodity unto itself, rather than the "inflation indicator". Or, perhaps it is still the inflation indicator and we just don't know we are in inflation yet.
Attractor: a level to which prices seem to be drawn, like a magnet. Usually these are lines of support or resistance from previous highs and lows, but can also be an important level on an indicator, or the edge of a Sunny_Band.
RSI: Relative Strength Index (TradeStation function)
SDMA: Sunny's Dynamic Moving Average (proprietary)
Sunny_Band: Sunny's Dynamic Moving Average plus 1.5 ATR and minus 1.5 ATR, creating a band on either side of the SDMA.
This commentary is meant only for EDUCATIONAL PURPOSES. It is to help you see how a Technical Analyst reads the signs in the markets.
Stay sharp and on your toes. Moves can reverse on a dime, anytime. Let the market speak to you. If the market is going down, by golly ignore my commentary from the night before and know that the market is going down.
RULES OF THUMB:
0. I keep the chart in Figure 1a on each day's commentary simply to illustrate how much in tandem the 4 indexes I watch actually are. For this reason, I don't always comment on every index. Analysis of one speaks highly for the same analysis for each of the other indexes.
1. When price is pushing the upper Sunny_Bands upward and then eases off and moves back toward the midline, it's time to take profits. If it starts moving up and pushing on the Sunny_Bands again, it's time to get back in. Likewise, if the market is pushing down on the lower Sunny_Band and eases off to move back to the midline, it's time to take profits from the short play.
2. Divergence of the RSI and price is another good time to take profits and wait for a breakout of price before taking a position.
3. When the exchange puts in curbs or trading halts on a large move down, it usually (not always) stops the downward motion. After the market reopens is a good time to take profits from your short position.
4. The market can't go nowhere forever. Eventually, who knows how long it will be, there will have to be a breakout-- one direction or the other.
5. This commentary is for educational purposes only, and is meant only to teach readers about my indicators, other technical indicators, and how I read them.
==<:>==
While it may be true that a picture is worth a thousand words, it is definitely not true that a picture deserves a thousand words.
