The Sunny Side of the Street
TECHNICAL ANALYSIS EDUCATION: EXPLAINED AND DECIPHERED FOR NEW AND
VETERAN TECHNICAL ANALYSTS ALIKE.
WEDNESDAY EVENING -
Oct 08, 2003
Archives of Past
Commentaries . How Did We Do?
Weekend Stock Picks --
CLICK HERE
| Anyone interested in posting comments or questions to the bulletin board may click here. Sunny personally answers each question or comment posted. | ||
I am conducting two seminars in January, if enough interest is shown. The seminars are intense workshops in which we not only follow a strict and intense agenda, but in which we take your specific questions and problems and work them into the content of the workshop. I will cover in depth the specific techniques I use that have been successful over the years, and show the ones which are not. I've been through the mill over the last 22 years, why should YOU have to reinvent the wheel? Interested? You send me your issues well in advance of the seminar and I tailor the discussions to address your issues. Only 15 people are allowed to come, and you'll be pleasantly surprised how much we cover in-depth. Click Here to view the agendas of the seminars. |
|
|
$56,893 in Stock Picks to date! Click Here to view.
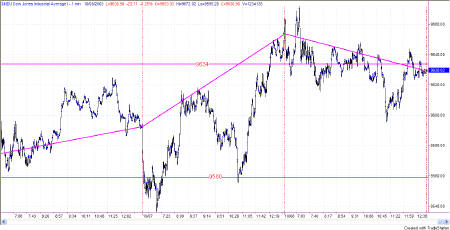
On Wednesday night's I go to church. Part of tonight's sermon was about patience. I bring this up because today's trading was one of those day's when you really need patience to trade. Officially it was a down day, from yesterday's close to today's close. But, if you will look at the Attractor at 9634, which has been in place for some time now, you can see that the market was back and forth all over that line.
Where was the money? Once again, only in scalping a few trades above and below the line.
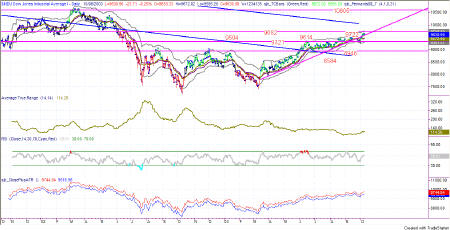
The Dow is still slowly, meaning you gotta have patience, climbing the trendline drawn in Figure 1b. The blue lines coming down across the chart are the channel formed on the weekly chart, which one of my clients asked me to look at a couple of weeks ago. That top channel line will meet the uptrending magenta line at about 9800-9900. That will be a point of impact for the market, more than likely where the market will pick up steam. Often that point of conjunction will be one where the market turns around and goes down afterwards, but this time I think it will be a power move. We haven't seen 10,000 on the Dow in a long time, and it's about time to get moving that direction again.
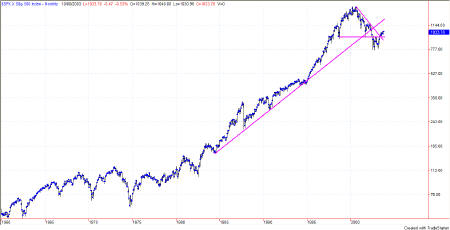
On the monthly chart of the SPX you can see that we are just barely into a long-term move that will take months to develop, again another reason for patience.
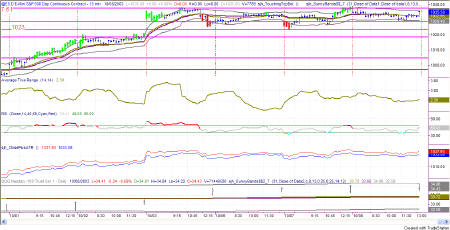
From Figure 1d, again we see another day of sideways movement between the upper and lower Sunny_Band, not venturing out on either side. Now it's four sideways days.
On the daily charts, the picture is still bullish, with prices holding in the upper half of the band, so my guess is still for prices to move above the band, carrying intraday prices there as well.
Attractor: a level to which prices seem to be drawn, like a magnet. Usually these are lines of support or resistance from previous highs and lows, but can also be an important level on an indicator, or the edge of a Sunny_Band.
PHW: Potential Hourly Wage. A term coined by Sunny to examine whether trading for a living is really worth it when compared to the minimum wage standard. Before considering a trading system to be a success, it should pass the PHW test.
RSI: Relative Strength Index (TradeStation function)
SDMA: Sunny's Dynamic Moving Average (proprietary)
Sunny_Band: Sunny's Dynamic Moving Average plus 1.5 ATR and minus 1.5 ATR, creating a band on either side of the SDMA.
This commentary is meant only for EDUCATIONAL PURPOSES. It is to help you see how a Technical Analyst reads the signs in the markets.
Stay sharp and on your toes. Moves can reverse on a dime, anytime. Let the market speak to you. If the market is going down, by golly ignore my commentary from the night before and know that the market is going down.
RULES OF THUMB:
0. I keep the chart in Figure 1a on each day's commentary simply to illustrate how much in tandem the 4 indexes I watch actually are. For this reason, I don't always comment on every index. Analysis of one speaks highly for the same analysis for each of the other indexes.
1. When price is pushing the upper Sunny_Bands upward and then eases off and moves back toward the midline, it's time to take profits. If it starts moving up and pushing on the Sunny_Bands again, it's time to get back in. Likewise, if the market is pushing down on the lower Sunny_Band and eases off to move back to the midline, it's time to take profits from the short play.
2. Divergence of the RSI and price is another good time to take profits and wait for a breakout of price before taking a position.
3. When the exchange puts in curbs or trading halts on a large move down, it usually (not always) stops the downward motion. After the market reopens is a good time to take profits from your short position.
4. The market can't go nowhere forever. Eventually, who knows how long it will be, there will have to be a breakout-- one direction or the other.
5. This commentary is for educational purposes only, and is meant only to teach readers about my indicators, other technical indicators, and how I read them.
==<:>==
While it may be true that a picture is worth a thousand words, it is definitely not true that a picture deserves a thousand words.


