The Sunny Side of the Street
TECHNICAL ANALYSIS EDUCATION: EXPLAINED AND DECIPHERED FOR NEW AND
VETERAN TECHNICAL ANALYSTS ALIKE.
WEDNESDAY EVENING -
Oct 15, 2003
Archives of Past
Commentaries . How Did We Do?
Weekend Stock Picks --
CLICK HERE
| Anyone interested in posting comments or questions to the bulletin board may click here. Sunny personally answers each question or comment posted. | ||
|
|
|
$56,893 in Stock Picks to date! Click Here to view.
Nearly a sideways day again, as a net result, but a day replete with trading opportunities. Speed traders and scalpers could have gone short, long, short and long for multiple profits out of a flat day.
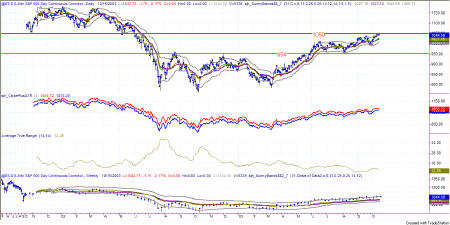
I caught some of the movement, but my strategy tells me to take only long trades in an overall long environment, so no shorts were caught. Today's sideways action left the long-term charts no worse for the wear. The daily chart of the ES shows the upper resistance that the market needs to break through, and may or may not.
As I said here yesterday, the current bull market is up 37% from its low, making it a nice run so far, in only a year's time. Today's non-event is probably just the chart banging up against resistance.
I am still expecting, as are most of my trader friends, more to the
upside. But, we shall have to wait and see. Another possibility
is for the market to begin trading in the channel formed by the two
Attractors shown in Figure 1b, and run for a while in between 954 and 1050.
In fact, that is probably the more likely of the scenarios.
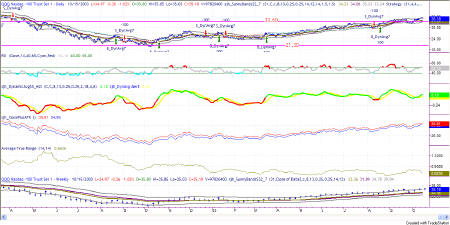
Figure 1c: QQQ Daily
On the daily chart, the QQQ is right at the corresponding channel line, from the ES. In fact, price is a bit higher than the 33.60 called for on the chart. With the price also showing above the Sunny_Bands (today's close was right on the band), I'm still voting bullish for the daily charts.
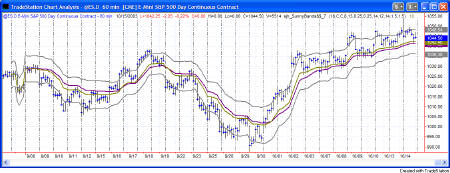
Yesterday we were forming new tops with nothing nearby as an Attractor to measure from. That probably gave the market a scare today, and it fell back toward the centerline. Mind you, it didn't touch it, I just said it fell back that direction. It is a show of weakness, but not necessarily weakness yet. As long as the chart in Figure 1d is still showing bullishness by staying above the midline, I'm still long-term bullish.
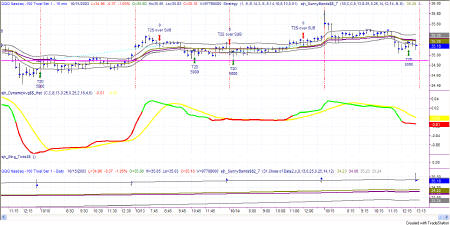
Figure 1e: QQQ 15 minute trading chart.
As for the trading strategy on the 15-minute chart, it kept me officially out of today's action until the end of the day, at which time it went long to hold overnight. I didn't take that trade, however, due to the configuration of the SDMAhst indicator. You can notice in Figure 1e that the yellow line is still on top of the red and green line, thus still in a bearish configuration. Price has been topping and retesting and I'm not bullish at the 15-min level at this time.
In Figure 1f you can see how the EMini chart matches up to the entries & exits on the QQQ chart. The system on the ES gave me a long trade this morning that turned out to be a loss, and then gave me the same buy late in the day, as I got on the QQQs.
So, story be told, I'm expecting two things from the market right now: further bullishness or a new sideways channel. If the market continues upward, breaking solidly out of its current position, then we have scenario one. However, if the markets start even the slightest correction, I would be quick to get short for the ride down to the lower channels I have pointed out earlier.
Attractor: a level to which prices seem to be drawn, like a magnet. Usually these are lines of support or resistance from previous highs and lows, but can also be an important level on an indicator, or the edge of a Sunny_Band.
PHW: Potential Hourly Wage. A term coined by Sunny to examine whether trading for a living is really worth it when compared to the minimum wage standard. Before considering a trading system to be a success, it should pass the PHW test.
RSI: Relative Strength Index (TradeStation function)
SDMA: Sunny's Dynamic Moving Average (proprietary)
SDMA_Hst: Sunny's Dynamic Moving Average presented in a histogram format where the line representing the difference between the two SDMA lines turns from red to green when the two SDMA lines cross each other (the difference is zero). The yellow line is an average of the histogram line.
Sunny_Band: Sunny's Dynamic Moving Average plus 1.5 ATR and minus 1.5 ATR, creating a band on either side of the SDMA.
This commentary is meant only for EDUCATIONAL PURPOSES. It is to help you see how a Technical Analyst reads the signs in the markets.
Stay sharp and on your toes. Moves can reverse on a dime, anytime. Let the market speak to you. If the market is going down, by golly ignore my commentary from the night before and know that the market is going down.
RULES OF THUMB:
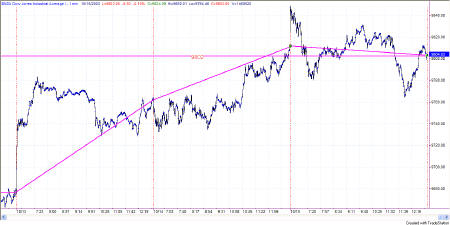
0. I keep the chart in Figure 1a on each day's commentary simply to illustrate how much in tandem the 4 indexes I watch actually are. For this reason, I don't always comment on every index. Analysis of one speaks highly for the same analysis for each of the other indexes.
1. When price is pushing the upper Sunny_Bands upward and then eases off and moves back toward the midline, it's time to take profits. If it starts moving up and pushing on the Sunny_Bands again, it's time to get back in. Likewise, if the market is pushing down on the lower Sunny_Band and eases off to move back to the midline, it's time to take profits from the short play.
2. Divergence of the RSI and price is another good time to take profits and wait for a breakout of price before taking a position.
3. When the exchange puts in curbs or trading halts on a large move down, it usually (not always) stops the downward motion. After the market reopens is a good time to take profits from your short position.
4. The market can't go nowhere forever. Eventually, who knows how long it will be, there will have to be a breakout-- one direction or the other.
5. This commentary is for educational purposes only, and is meant only to teach readers about my indicators, other technical indicators, and how I read them.
==<:>==
While it may be true that a picture is worth a thousand words, it is definitely not true that a picture deserves a thousand words.
