The Sunny Side of the Street
TECHNICAL ANALYSIS EDUCATION: EXPLAINED AND DECIPHERED FOR NEW AND
VETERAN TECHNICAL ANALYSTS ALIKE.
WEDNESDAY EVENING -
Oct 22, 2003
Archives of Past
Commentaries . How Did We Do?
Weekend Stock Picks --
CLICK HERE
| Anyone interested in posting comments or questions to the bulletin board may click here. Sunny personally answers each question or comment posted. | ||
|
|
Any readers who are local to the Los Angeles area: I will be speaking to the Newport Beach chapter of the DayTraders USA group this Saturday morning at 8:30am. I will also be lingering in the area after the talk for a couple of hours (due to schedule conflicts with my ride) incase any of you want to hear more. Click here for more info. |
$57,979 in Stock Picks to date! Click Here to view.
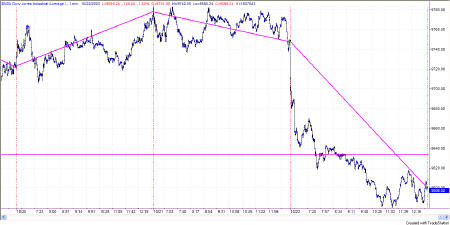
Figure 1a: 01 Minute Dow
The day after a day of congestion is usually a "big move" day. Yesterday's movement was sideways, back and forth across a midline, just waiting for an opening to do something like today (either up or down). The Average True Range (daily) on the Dow is 99.85. Today's down move was 149 points. Just about a normal day as far as the ATR was concerned, for the past two days. One day with little movement and one day with a lot of movement equals one day with average movement.
Or, you could look at it another way, and say that yesterday's congestion led to today's 150% move. (If a normal day is 100 points, then a day of 150 points is a 150% day.)
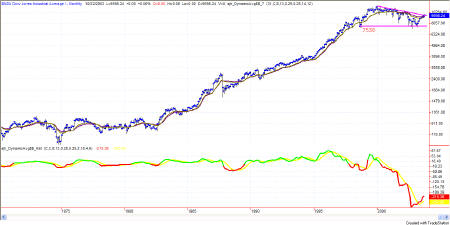
Looking very broadly, at the monthly Dow, the market is still working off the pennant in Figure 1b. In fact, if we narrow the perspective and focus in on the Ascending Triangle itself, we can
see, in Figure 1c, that today's move was a little bitty move back toward the pennant line, which needs still to be tested. The move back to the line will either result in penetration and failure or in a bounce which will show up as bullish excitement. If it shows as penetration of the trendline, then most likely the market will drop to the Attractor (support) at 7538. In that case
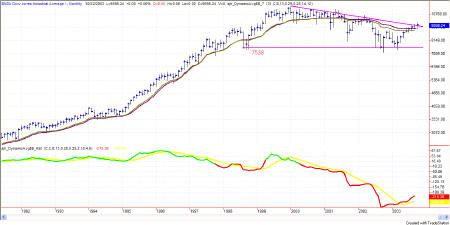
Figure 1c: Monthly Dow focused on Pennant
we would be looking at a 200 point correction on the Dow. In keeping with the Sunny-tradition of continually asking "What Is True?" we have reached just such a juncture and asking the questions nets the answer, "we don't yet have enough information." So then, let's take a look at another chart. What do the indicators on the daily charts tell us?
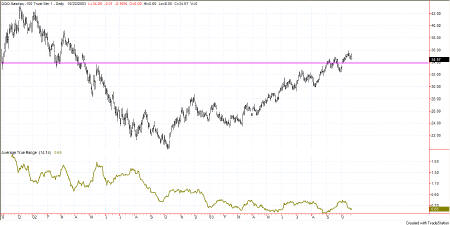
On the daily chart of the QQQs there is an Attractor at 33.90, where lows and highs met in early 2002. That Attractor is now being approached from above, with price inching closer
downward each day or two. The current QQQ is at 34.57, and the current daily ATR on the QQQ is now as low as $0.65. The distance from current to Attractor is 34.57-33.90=$0.67, or the equivalent of one day's ATR. Hummmm. That puts us in the position of wanting one more down day at the current ATR to meet up with the Attractor. That would then position us for a nice bounce upward and at the same time would have taken some of the pressure off the upward bound move, thus leaving more room for moving on the upside.
What do the Sunny_Bands and SDMA say?
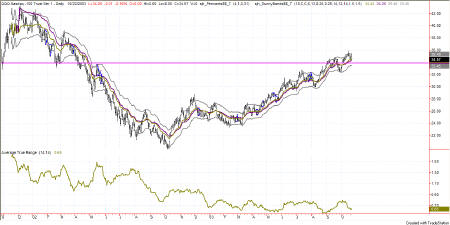
Figure 1e: Daily QQQ with Sunny_Bands.
The Sunny_Bands make the Attractor more apparent, for one thing, as the bands surround the areas in question and make them more prominent when it comes time to search for highs and lows. Of even more interest is that prices have stayed in the upper half of the bands, denoting strength and bullishness, not weakness. If this continues, as the price attempts to touch the Attractor, then I would expect a rounding to happen and the preferred direction to continue bullish and thus pull the bands and the trend on up with it.
The likelihood then is not for a great 4th wave melt-down, but for a sideways correction that channels us through the range of 35.40 to 33.45 on the QQQs (and on the EMinis from 1013 to 1048). The one-wave took place over a time span of about 3 months, and the two-wave took about 3 months. The 3-wave has spent about 7 months developing, and all of this adds up to about 3-7 months in the impending 4 wave. That's going to be a killer, psychologically, as most traders don't particularly love watching loss after loss after loss build up in their portfolios, myself included.
If, then, that's what begins to unfold, then we should change strategies from trend following to channel scalping, buying when RSI or Stochastics hit bottom and selling when either hits the top. If the wave lasts only 3 months, it will be over with quickly and traders will have to shift gears quickly as it ends; if it lasts a long time, then traders will get bored near the end and start stabbing in the dark, trying to get a trend trade to happen.
Just hold on tight. The market will go where IT wants to go. Our job is just to follow along closely.
This whole diatribe on sideways channels applies, of course, only if we go into a sideways channel. If we bounce off the Attractor at 33.90 and start another leg upward, follow it!
Stay with, not against, the moving averages!
Attractor: a level to which prices seem to be drawn, like a magnet. Usually these are lines of support or resistance from previous highs and lows, but can also be an important level on an indicator, or the edge of a Sunny_Band.
PHW: Potential Hourly Wage. A term coined by Sunny to examine whether trading for a living is really worth it when compared to the minimum wage standard. Before considering a trading system to be a success, it should pass the PHW test.
RSI: Relative Strength Index (TradeStation function)
SDMA: Sunny's Dynamic Moving Average (proprietary)
Shooting Star: A candlestick pattern discussed further under Reference, Candlesticks.
SDMA_Hst: Sunny's Dynamic Moving Average presented in a histogram format where the line representing the difference between the two SDMA lines turns from red to green when the two SDMA lines cross each other (the difference is zero). The yellow line is an average of the histogram line.
Sunny_Band: Sunny's Dynamic Moving Average plus 1.5 ATR and minus 1.5 ATR, creating a band on either side of the SDMA.
Vehicles: Trading symbols. IBM is an equity vehicle; SPU03 is the SP futures contract that expires in Sept of 2003; @ES.D is the EMini; mutual funds are vehicles; gold is a trading vehicle; etc.
This commentary is meant only for EDUCATIONAL PURPOSES. It is to help you see how a Technical Analyst reads the signs in the markets.
Stay sharp and on your toes. Moves can reverse on a dime, anytime. Let the market speak to you. If the market is going down, by golly ignore my commentary from the night before and know that the market is going down.
RULES OF THUMB:
0. I keep the chart in Figure 1a on each day's commentary simply to illustrate how much in tandem the 4 indexes I watch actually are. For this reason, I don't always comment on every index. Analysis of one speaks highly for the same analysis for each of the other indexes.
1. When price is pushing the upper Sunny_Bands upward and then eases off and moves back toward the midline, it's time to take profits. If it starts moving up and pushing on the Sunny_Bands again, it's time to get back in. Likewise, if the market is pushing down on the lower Sunny_Band and eases off to move back to the midline, it's time to take profits from the short play.
2. Divergence of the RSI and price is another good time to take profits and wait for a breakout of price before taking a position.
3. When the exchange puts in curbs or trading halts on a large move down, it usually (not always) stops the downward motion. After the market reopens is a good time to take profits from your short position.
4. The market can't go nowhere forever. Eventually, who knows how long it will be, there will have to be a breakout-- one direction or the other.
5. This commentary is for educational purposes only, and is meant only to teach readers about my indicators, other technical indicators, and how I read them.
==<:>==
While it may be true that a picture is worth a thousand words, it is definitely not true that a picture deserves a thousand words.
