The Sunny Side of the Street
TECHNICAL ANALYSIS EDUCATION: EXPLAINED AND DECIPHERED FOR NEW AND
VETERAN TECHNICAL ANALYSTS ALIKE.
TUESDAY EVENING -
Oct 28, 2003
Archives of Past
Commentaries . How Did We Do?
Weekend Stock Picks --
CLICK HERE
| Anyone interested in posting comments or questions to the bulletin board may click here. Sunny personally answers each question or comment posted. | ||
|
|
Yet another day with TradeStation not working. So, here's my commentary without indicators, using charts from Yahoo Finance. |
$57,979 in Stock Picks to date! Click Here to view.
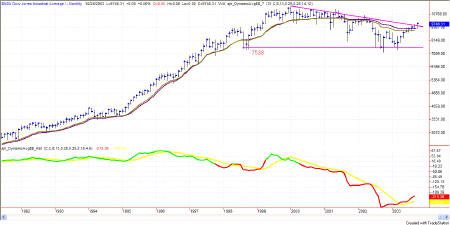
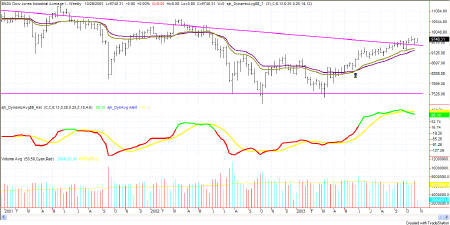
The Dow appears, on the monthly chart, to have soundly broken out of the descending triangle with which it has spent months struggling. This, to me, is a strong bullish signal. Volume over the course of the symmetrical triangle has grown larger throughout. Let's now look at a chart of one lesser compression (i.e. weekly).
The weekly chart of the Dow shows that the Dow has been out of the triangle now for 5 or 6 days on the closes. (Intraday moves through the line don't count).
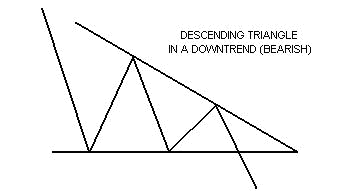
Read the reference by clicking on the picture.
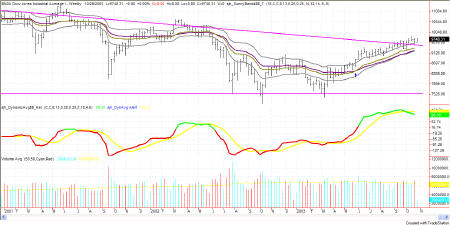
On the same weekly chart, this time I have included the Sunny_Bands, showing that price has been above the Sunny_Bands midchannel, and the upper channel for a long time. The point at which I became bullish on this chart is marked by a blue up arrow, which is also where price had a good closing above the upper band.
This has been a good run on the Dow, from 8850 (5/30/03) to its current 9748, just about 900 points.
Now, however, the SDMA_Hist is showing its early hints of downward pressure. The green line crossed through the yellow line, putting the yellow now on top and the red/green on the bottom. Generally this happens when a new down move is forming, or when we are heading into a new channel pattern that will last for some time.
So, let's get some more ideas, by looking at some more charts.
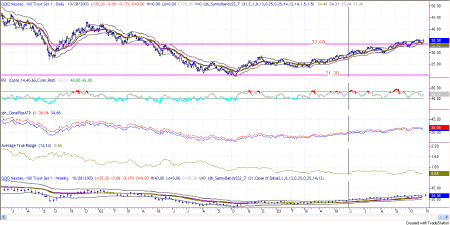
I had to go pretty far back (squeezing) on the daily chart of the QQQs to get any pattern formation happening. At that point, shown in the chart above, about the same amount of time is shown above the line, which is this time the 33.60 Attractor. This speaks to the bullish side of my mind, with the next Attractor on the upside being at 39.15, where bottoms and tops were both kicking around trying to decide whether to go lower or higher. And, it's happening again. It looks to me like it's trying to go higher. It will take a while to get as high at 39.15, but I think that's where it's going.
The current ATR on the QQQ is 0.65. The Attractor at 39.15 is 3.79 points away from today's close of 35.36. At the current speed (0.65 points per day) it would take about 6 days of up days to make it to the 39 level. Now when was the last time you saw 6 up days in a row? That's been a while. So, let's guess it will take about 9 or 10 days to get there, if the market is strong.
That is also the point about which we should complete a 5th wave up on the Elliott count. Also take a look at the RSI on the chart above. It has consistently stayed above the 40 level, telling us it is in bullish behavior. And, it has put in several jumps above the 65 line, confirming the bullishness. So, here we go, further up.
According to the ATR theory, we should see 36.06 tomorrow. And, yet, there have been and still are divergences to tell us that bearishness is near at hand. So keep on your toes.
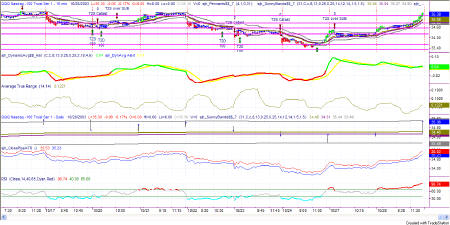
Today's 15 min chart stayed above the Sunny_Bands midline if not the upper line all day. Each bar all day hugged that upper Sunny_Band, showing really strong bullish behavior. The wave count on the 15-min chart makes me think that we are in for a 4-wave down in the first part of the day and a 5th wave up to finish the day higher. At that juncture we will be battling the former highs at 35.60 on the QQQ.
Same story is true on the EMinis, with the first battle line being drawn at 1047 "in the sand", followed by a higher line at 1050. I don't know how the Elliottician's will be counting this one, but probably an extended 5th or something. It needs to go higher, and we've already had 3 waves, so make up something to call it. On the EMini, as well as the QQQs, I think it will take a little pressure off first in the morning before turning up in the afternoon to close higher.
Attractor: a level to which prices seem to be drawn, like a magnet. Usually these are lines of support or resistance from previous highs and lows, but can also be an important level on an indicator, or the edge of a Sunny_Band.
PHW: Potential Hourly Wage. A term coined by Sunny to examine whether trading for a living is really worth it when compared to the minimum wage standard. Before considering a trading system to be a success, it should pass the PHW test.
RSI: Relative Strength Index (TradeStation function)
SDMA: Sunny's Dynamic Moving Average (proprietary)
Shooting Star: A candlestick pattern discussed further under Reference, Candlesticks.
SDMA_Hst: Sunny's Dynamic Moving Average presented in a histogram format where the line representing the difference between the two SDMA lines turns from red to green when the two SDMA lines cross each other (the difference is zero). The yellow line is an average of the histogram line.
Sunny_Band: Sunny's Dynamic Moving Average plus 1.5 ATR and minus 1.5 ATR, creating a band on either side of the SDMA.
Vehicles: Trading symbols. IBM is an equity vehicle; SPU03 is the SP futures contract that expires in Sept of 2003; @ES.D is the EMini; mutual funds are vehicles; gold is a trading vehicle; etc.
This commentary is meant only for EDUCATIONAL PURPOSES. It is to help you see how a Technical Analyst reads the signs in the markets.
Stay sharp and on your toes. Moves can reverse on a dime, anytime. Let the market speak to you. If the market is going down, by golly ignore my commentary from the night before and know that the market is going down.
RULES OF THUMB:
0. I keep the chart in Figure 1a on each day's commentary simply to illustrate how much in tandem the 4 indexes I watch actually are. For this reason, I don't always comment on every index. Analysis of one speaks highly for the same analysis for each of the other indexes.
1. When price is pushing the upper Sunny_Bands upward and then eases off and moves back toward the midline, it's time to take profits. If it starts moving up and pushing on the Sunny_Bands again, it's time to get back in. Likewise, if the market is pushing down on the lower Sunny_Band and eases off to move back to the midline, it's time to take profits from the short play.
2. Divergence of the RSI and price is another good time to take profits and wait for a breakout of price before taking a position.
3. When the exchange puts in curbs or trading halts on a large move down, it usually (not always) stops the downward motion. After the market reopens is a good time to take profits from your short position.
4. The market can't go nowhere forever. Eventually, who knows how long it will be, there will have to be a breakout-- one direction or the other.
5. This commentary is for educational purposes only, and is meant only to teach readers about my indicators, other technical indicators, and how I read them.
==<:>==
While it may be true that a picture is worth a thousand words, it is definitely not true that a picture deserves a thousand words.
