The Sunny Side of the Street
TECHNICAL ANALYSIS EDUCATION: EXPLAINED AND DECIPHERED FOR NEW AND
VETERAN TECHNICAL ANALYSTS ALIKE.
WEDNESDAY EVENING
- Jan 28, 2004
Archives of Past
Commentaries . How Did We Do?
Weekend Stock Picks --
CLICK HERE
| Anyone interested in posting comments or questions to the bulletin board may click here. Sunny personally answers each question or comment posted. | ||
|
$74,599 in Stock Picks to date! Click Here to view. Available Sunday nights.
Right on target! Today's intraday action was about as sideways as it can get until 11:15aPT. Then the markets broke below the Attractors and it was on down from there.
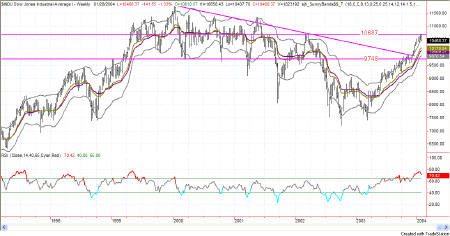
On the long-term, I am still expecting a 1000 point sideways channel to develop, which will take months in the developing. Be careful of any attempts to hold onto positions too long, as the market could give some wild whipsaws in through here.
Today's action confirms this theory, taking the markets down close to but not quite all the way to the bottom Sunny_Bands. That says to me that there is more to go on the downside as this sideways channel begins its formation.
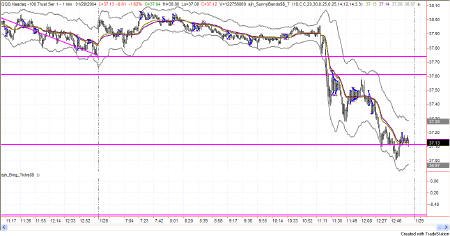
Figure 2: QQQ 01 minute intraday
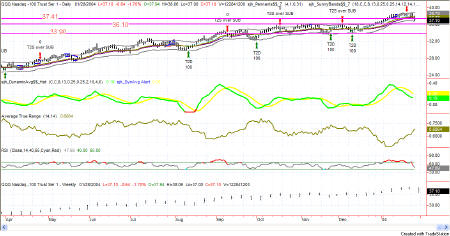
The daily RSIs are now in the 50ish range with the possibility for more downside action in order. The likelihood is now for price action to head on downward taking the RSI to the 30-40 range before it's over.
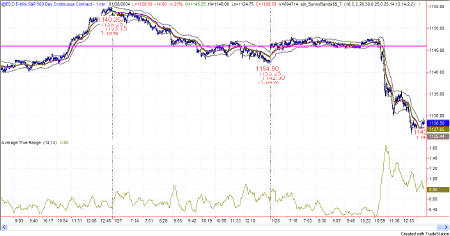
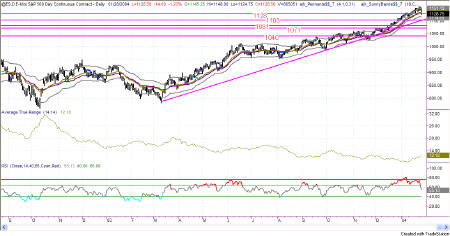
Figure 3: EMini 01 minute intraday
The signal on the QQQ daily chart is still short, with several layers of Attractors on the way down. The first level of support I see for the QQQ is at 36.10 with the next level showing at 33.90.
On the EMini, the first level of support is down at 1128, although it was broken on the intraday chart the EMini did not close below that level yet. The next level down from there is at 1103, which is closer to the trendline and where I am expecting the bounce that is going to form this sideways channel.
On both the daily charts you can see the hesitation evident in the current congestion of the QQQ and the EMini. Both RSIs have shown negative divergence, calling for a bit of a pullback in here. I get the feeling that the pullback is not likely to be harsh, but rather a showing of congestion, as I have mentioned on the weekly chart of the Dow.
With the long-term trendline still below current price action, there is some pull on price both from that Attraction and from the lines in Figure 5 which come from several years ago.
Keep your senses about you and use strict discipline in trading. Trading is a risky business.
Attractor: a level to which prices seem to be drawn, like a magnet. Usually these are lines of support or resistance from previous highs and lows, but can also be an important level on an indicator, or the edge of a Sunny_Band.
PHW: Potential Hourly Wage. A term coined by Sunny to examine whether trading for a living is really worth it when compared to the minimum wage standard. Before considering a trading system to be a success, it should pass the PHW test.
RSI: Relative Strength Index (TradeStation function)
SDMA: Sunny's Dynamic Moving Average (proprietary)
Shooting Star: A candlestick pattern discussed further under Reference, Candlesticks.
SDMA_Hst: Sunny's Dynamic Moving Average presented in a histogram format where the line representing the difference between the two SDMA lines turns from red to green when the two SDMA lines cross each other (the difference is zero). The yellow line is an average of the histogram line.
Sunny_Band: Sunny's Dynamic Moving Average plus 1.5 ATR and minus 1.5 ATR, creating a band on either side of the SDMA.
Vehicles: Trading symbols. IBM is an equity vehicle; SPU03 is the SP futures contract that expires in Sept of 2003; @ES.D is the EMini; mutual funds are vehicles; gold is a trading vehicle; etc.
This commentary is meant only for EDUCATIONAL PURPOSES. It is to help you see how a Technical Analyst reads the signs in the markets.
Stay sharp and on your toes. Moves can reverse on a dime, anytime. Let the market speak to you. If the market is going down, by golly ignore my commentary from the night before and know that the market is going down.
RULES OF THUMB:
0. I keep the chart in Figure 1a on each day's commentary simply to illustrate how much in tandem the 4 indexes I watch actually are. For this reason, I don't always comment on every index. Analysis of one speaks highly for the same analysis for each of the other indexes.
1. When price is pushing the upper Sunny_Bands upward and then eases off and moves back toward the midline, it's time to take profits. If it starts moving up and pushing on the Sunny_Bands again, it's time to get back in. Likewise, if the market is pushing down on the lower Sunny_Band and eases off to move back to the midline, it's time to take profits from the short play.
2. Divergence of the RSI and price is another good time to take profits and wait for a breakout of price before taking a position.
3. When the exchange puts in curbs or trading halts on a large move down, it usually (not always) stops the downward motion. After the market reopens is a good time to take profits from your short position.
4. The market can't go nowhere forever. Eventually, who knows how long it will be, there will have to be a breakout-- one direction or the other.
5. This commentary is for educational purposes only, and is meant only to teach readers about my indicators, other technical indicators, and how I read them.
==<:>==
While it may be true that a picture is worth a thousand words, it is definitely not true that a picture deserves a thousand words.
