

ANNOUNCING: SunnyBands + DMA_Histogram + Slope for METASTOCK. Click here.
ALPHABETICAL QUICKLINKS:
>> Custom Pricing <<
[A] Advertising | ADX-Smoothed | AllAverages | Autographed TSME
[B] BingTicks Positions | BoxesInBoxes| BuyHold Profit
{C] CandleStick Indicators | Classifieds | Comprehensive Glossary | Consulting & Mentoring | Correspondence Course | CPC Index | CurrentPrice (SM) | Custom Programming | TS Customer Support
{D] DayHiLo | DaysOfWeek | DaySession | DayDividers | Disclaimer | Display Ads | Distance Learning | Dynamic Moving Averages (Dynamic Moving Average Crossover PaintBar, DynamicMovingAverage RadarScreen, DMA_Histogram, DMA_Function)
[E] EasyLanguage Forum | "Using EasyLanguage 9.x" | ExitStrategies | ExpirationFriday (and RollOver Thursday) | EasyLanguage Forum
[G] Glossary, Comprehensive
[M] MovAvg_3Lines
[O] OTHER PRICES - construct your own Total w/ the price Sunny gave you
[P] Pennant Finder | PHW | Programming | Putt Book
[R] Red Light - Green Light | RSI Smoothed
[S] Sam Tennis Products | Sessions (Paint Day and Night) | NEW: Slope of DMA | "Sunny Side of the Street" | SunnyBands | SunnyBands_Function | SunnyBars
[T] Trade Along with Sunny | TradeStation Customer Support | "TradeStation Made Easy!" |
[U] Ultimate-F | "Using EasyLanguage 9.x" (Putt Book)
[V] Vendors
[W] What Time Is It? | Who's On Top?
OTHER PRICES (construct your own price; calculate discounts)
Trade with SunnyBands software FOR FREE! Click Here!
Buy NinjaTrader version (SunnyBands & DMA_H) & Get TradeStation version 1/2 Price! or Vice Versa!
ALL PRODUCTS HEREIN WERE FOR TRADESTATION OR MULTICHARTS...however NOW
Get a Second Version at 1/2 price! (Get Sunny Bands for TradeStation and for NT or MetaStock...2nd one is 1/2 price).
![]() SUBSCRIBE to Trade Along with Sunny NOW and SAVE!
SUBSCRIBE to Trade Along with Sunny NOW and SAVE!
NOTE: BEFORE YOU LICENSE ANY OF MY PRODUCTS
, PLEASE READ, SIGN AND SEND ME THIS DISCLAIMER & LICENSE AGREEMENT. Your use of this website is acknowledgement that you agree to the Disclaimer & License terms.
TRADING IS RISKY BUSINESS, AND MOST PEOPLE WHO TRY IT LOSE THEIR MONEY. Invest in your education so you'll have a better chance.
ALSO: Before you call me for consultation or help, please have Zoom, TeamViewer or Skype running so we can share computers. I can help you better if I can see what you are doing.
PRODUCTS: Advertising | Education | Correspondence Course | Mentoring | Products & Prices | Indicators | Strategies | LIVE Trading Room | Download Product Manual | Jump to Product Descriptions | Works of Samuel K. Tennis | EasyLanguage Forum
Documentation
If you would like to read the Documentation ("Users' Manual") for these products before trying them, just click here to download the pdf Indicator Manual. (It's always a work in progress and not always up-to-date.)
Pictures of Products
 To take a gander at the pictures of my products, just click here. You can compare indicators and strategies, paintbars and showmes, across timeframes and symbols. You can see how these products would be useful to you in your trading. As they say, a picture is worth a thousand words. The pictures are all on the Products page, along with descriptions telling how I use them. Then, come back here to place your order.
And remember, a 7-day trial is FREE. Click Here if you are interested.
Questions
If you have any questions, I'd love to talk with you about how I use these indicators to Govern my own trading.
And, if you are having trouble getting in touch with TradeStation Customer Support, give me a call. We can help you ourselves. (I have an on-call team.) No sales; just help. If I can't help you my service is free.
Give me a call at (760) 908-3070 or skype at sunnyjharris, considering PT etiquette. If I don't answer, just leave a short message (with your name and phone number) and I'll get back to you as quickly as I can.
You can call me on my cell phone. Just ask first whether I'm driving, before you assume I'm sitting in front of my computer. That number is 1-760-908-3070.
EasyLanguage (EZL) Forum Slides and Videos
If I have offered you a discount on any item, or a special price because you attended my webinar, you will need to go down to the Orange Area where it says "Other Prices" and construct a custom price by piecing together values to add to the total.
| ADVERTISING | Your ad will run on a monthly basis. Click here to view sample ads & sizes. |
|||
| DISPLAY ADS | ||||
| CLASSIFIEDS | Choose your text and your heading. Come back here to pay for it. Your ad will run on a monthly basis. Choose payment under Ad Sizes above. View our current Classified Ads. |
|||
|
INDICATORS & STRATEGIES |
||||
| ADX-SMOOTHED | A new look at an old indicator. ADX_Smoothed uses Sunny's masterful DMA (Dynamic Moving Average) to smooth the whipsaw out of the traditional ADX. Click here to see what it looks like and how it compares to the original ADX calculations. |
|||
| ALL_AVERAGES |
In the past, when testing moving average strategies, I would keep copius spreadsheets of the results, attempting to make some sense of them. How do you compare all the types of MAVs one at a time? It's laborious. So, I created an indicator and a strategy that contained all the MAVs I could think of (including mine, if you have already licensed it), in ONE PLACE. The cool thing about a strategy with all the averages is that you can optimize the inputs and compare all the outputs on a Performance Report. $224 for both indicator & strategy |
|||
AUTOGRAPHED COPY OF "TRADESTATION MADE EASY!" |
||||
 |
Want your own personally AUTOGRAPHED copy of Sunny's new book, "TradeStation Made Easy!" ? Order it here and send an email to Sunny telling how you would like it inscribed. Easy as that! And all it costs is retail price plus shipping. |
|||
B |
||||
| This special indicator is one of Sunny's favorites. It plays a sound at every tick of the market: one sound for up ticks and a different sound for down ticks. There is another sound for sideways and yet another for the close of the market. With this indicator, I listen for changes in market activity, excitement levels, and even can step away from the monitor and just listen for a while. I couldn't trade without it. (Included is the Indicator is a file of Sounds for you to choose from.) |
||||
| This special indicator is one of Sunny's favorites. It not only plays a sound at every tick of the market: one sound for up ticks and a different sound for down ticks. There is another sound for sideways and yet another for the close of the market. This new and improved model plays all the market sounds, BUT IN ADDITION it speaks to alert you to your current market position and number of contracts! |
||||
| Introducing the latest innovation: the Sunny Harris Indicator Boxes in Boxes! This revolutionary tool is designed to provide crystal-clear insights into market fractals, helping traders navigate the complexities of financial markets with precision and confidence. With this Sunny Harris Indicator, you'll uncover patterns and trends like never before, empowering you to make informed decisions and seize lucrative opportunities. Say goodbye to guesswork and hello to a new era of trading excellence. Try it today and experience the difference for yourself! See 3 different timeframes on one chart. In this clip I have Daily, Weekly and Monthly represented.
|
||||
| This little indicator is FREE. You just need to ask for it. BuyHold prints the buy and hold profit potential of the symbol from the beginning of the data on the chart, to the last bar. It is a good thing to know which makes more: your trading or simply Buy and Hold. It's one of these indicators I use to make my trading life simpler. Email Me. |
||||
C |
||||
|
Here it is! Finally my CandleStick Patterns are available. This set of Indicators pick out and label these common patterns: Doji Morning & Evening Doji, Hammer & Hanging Man, Bullish & Bearish Engulfing, Bullish & Bearish Harami Cross, Shooting Star, Piercing Line & Dark Cloud. If you like CandleSticks you should definitely have this set of indicators. They all come together as a package for just $495. You can jump to the Products page to see a chart with the patterns on it. |
||||
| CONSULTING, COACHING & MENTORING | ||||
Ask all the questions you want; have Sunny lead you down the paths to success. After 43+ years of trading and research, she's been through it all. "Nothing teaches better and faster than making mistakes -- and I've made my share." Even so, EDUCATION IS MUCH CHEAPER THAN DRAWDOWN! Click here to read our Consulting flyer or our Education flyer. Click here to see what other people say about Sunny's products. Here's just one example: "It's been a pleasure working and meeting with you. Since our meeting the strategies have produced 10 positive trades in a row." I only take serious students. If you are a tire kicker, not really ready to pursue a career of trading, kick somewhere else. |
||||
| CONSULTING / MENTORING / PROGRAMMING HOURLY: NOTE: Minimum time: 1 hour. PROGRAMMING TO YOUR SPECIFICATIONS:
CONSULTING & MENTORING: |
||||
| 1 hour |
|
|||
| 5 hour package |
|
|||
| 10 hour package | 10 hours OLD PRICE: $7,815.00 | NEW PRICE: $4,280.00* ($428.00 /hr) | |||
| Full Day in Person | *NOTE: The more hours you buy, the less they cost. Look at the hourly equivalent for 10 hours versus 1 hour. | |||
|
$25 / 5 minute increment ... get all the help you need and you don't have to hold on the line for hours. |
||||
|
|
||||
| "Solving the Puzzle"" click here to view information about the course. "EasyLanguage Made Easy!" click here to view information about the course |
||||
| CPC INDEX | Sunny's proprietary calculation which allows you to compare any system to all others. Know your CPC Index and you'll know whether a system is tradeable or not. (View Chart) |
|||
| CURRENT PRICE (SM) | Here's another tool that I programmed to make my trading life easier. I call it SM_CurrentPrice, for ShowMe the Current Price. This indicator puts a dot to the right of the current price. The dot is red if the last price movement was down, and a green dot shows that the last price movement was upward. I really like these ease-of-use tools because they limit the thinking I have to do and let me focus more on real trading. |
|||
| CUSTOM PROGRAMMING |
Sunny will program EasyLanguage/PowerLanguage indicators, paintbars, showmes, functions and strategies to your specifications. "Tell me what you want and I'll give you an estimate." $225/hr* Click here to jump to the Consulting section to purchase time. |
|||
| CUSTOMER SUPPORT for TradeStation | If you have ever experienced frustration when trying to get ahold of TradeStation Customer Support, give me a call. I can troubleshoot most problems. $120/hr billed in 5 minute increments ... just $10/increment! Click here to jump to the Consulting section to purchase. |
|||
D |
||||
| DAY OPEN HI LO LINES | Often the market will use the day's hi or low, or the opening values, as Support and Resistance. We will often see price making a run for these values. I like to have the lines automatically drawn on my chart, so I can "predict" coming prices. It's another way I keep things easy. (View Chart). |
|||
| DAYSESSION (PB) | I like to know, at a glance, whether a test I ran produced trades in the day or night session. With this indicator, the DaySession bars are colored blue in this chart, while the Extended-Session bars are green. This makes life a lot easier for me, when I can tell which session I'm in at a glance. (View Chart) |
|||
| DAYS OF WEEK (PB/labels) | In my books I make a point of telling the readers that you need to make as many things as possible "mindless." That is, you identify a day of the week with a color and your mind will make that association automatically without any purposeful thinking. Aids such as this make your trading all that much more consistent. (View Chart) |
|||
| DAYS OF WEEK (PB labels) | Another way to distinguish days, rather than painting them colors, is to put a letter above the bar, signifying the day. This one I call DaysOfWeekLabels: (View Chart) |
|||
| DAY-DIVIDERS | These bars are drawn on the chart to show where today begins and ends. It makes it easy to see where the night session is. Some people like to trade the night session, some like to avoid it. Either way, this indicator makes it easy to see your options. |
|||
| DYNAMIC MOVING AVERAGES |
||||
| purchase below |
Indicator for Charting View Chart Like no other, this indicator does a great job of avoiding most whipsaw. No other moving average accomplishes this. My indicator dynamically calculates its own lengths in the mathematics, with every tick of the market. |
|||
| purchase below |
DMA Histogram Indicator for RadarScreen View Chart With this configuration, you can see the crossover values on any symbol as they form. |
|||
| purchase below |
DMA Strategy View Chart The beauty of this strategy is that, unlike so many others, this one avoids a significant portion of the whipsaw activity. |
|||
| purchase below |
DMA_H Histogram for charting View Chart for TradeStation and MultiCharts: This indicator highlights the speed of the change of the moving averages by showing them in gold and red for up moves, and green and purple for down moves. It is uncanny how quickly this indicator pegs market turns. |
|||
| purchase below |
DMA_H Histogram for RadarScreen View Chart for TradeStation and MultiCharts: This indicator highlights the speed of the change of the moving averages by showing them in gold and red for up moves, and green and purple for down moves. This indicator fills the cells with the associated colors for the DMA_H and gives you a Direction (Dir) that highlights whether the symbol is currently moving up (//), down {\\}, up but has turned down (/\) or down but has turned up (\/). It is uncanny how quickly this indicator pegs market turns for all the symbols in your RadarScreen. |
|||
| purchase below |
DMA Histogram Slope View Chart With this configuration, you can see the Slope of the DMA MIdLine at a glance. |
|||
| purchase below |
DMA Crossover Marker View Chart for TradeStation and MultiCharts: Paints the Bar where the Dynamic Moving Average actually crosses over. Much easier to read the DMA visually! |
|||
| purchase below |
NEW: DMA Function This function allows you to program EasyLanguage code using my DynamicMovingAverage in your own programs. The function's outputs allow you to use the values internal to the DMA as inputs to your own studies and strategies. | |||
| Order any 3 DMA Components together and get 50% off after the first. (Calculate by hand & use "Other Prices") No other discounts apply. |
||||
| PURCHASE HERE >> |
You may choose more than one by adding them to the cart one at a time. If you are buying more than one, jump to Other Prices and construct your 15% off discounted price. IF buying 3 or more, take 50% off after the first. | |||
| E | ||||
| EXIT STRATEGIES | The ExitsStrategies allow you to optimize on all the built-in TradeStation exits as well as a few more specialty exits, all in one place. (View Chart) |
|||
| EXPIRATION FRIDAY | Ever worry that you might enter a trade for the wrong front-month? Ever worry about which Thursday is roll-over and which Friday is expiration Friday? Never fear, a PaintBar's here. The magenta bars are all on Expiration Friday. The other colored bars show session changes from day to extended. With a simple switch you can also highlight the Roll-Over Thursdays. (View Chart) |
|||
| G | ||||
| GLOSSARY, COMPREHENSIVE | The glossary page in this website has a wealth of terms defined for your ease-of-use. But, if you really get into trading and want to be an expert, you need to study all the jargon and be versed in both old and new terminology. Sunny's Comprehensive Glossary goes way beyond what is available in the website, or any other single website. This glossary has been collected from many, many sources over many years of study. Because so much work has gone into it, it is no longer free. The cost of this glossary just barely covers the cost of printing and mailing. But, it is well worth it. You won't find this information anywhere else. |
|||
| M | ||||
| MOVING AVERAGE 3 LINES | This indicator makes displaying the "standard" moving averages that the "big boys" watch really simple. The average lengths are input values, so of course you can change them, but the defaults are 21, 50 and 200. These are the averages you hear about on IBD, WallStreet Journal and all the financial podcasts. I believe that if all the big boys are watching them, then I should too! Just $454 |
|||
| P | ||||
| PENNANT FINDER | Some people like to trade breakouts, rather than moving averages. This indicator was designed for a client who preferred to trade breakouts. The indicator marks areas of congestion with little triangles that show the top value and bottom value to use for breakouts. (View Chart) (For TradeStation and MultiCharts) |
|||
| PHW (Potential Hourly Wage) | This is Sunny's main research tool. I use it for marking yellow dots on all significant turning points. Then the indicator calculates: the date range of the symbol; Buy and Hold; the number of ideal trades; the ideal profit; and the PHW profit (which is 60% of the ideal). (View Chart) (For TradeStation and MultiCharts) |
|||
| PHW Lower | This indicator goes on the lower subgraph of your chart and shows you how much profit was possible in previous trades. It's a great way to see how much you are leaving on the table. Are the ideal trades $500 and you are only keeping $125? Learn to quit getting out too early with this fantastic tool. (View Chart) |
|||
| PROGRAMMMING | Have a great idea for trading, but don't know how to code it? Give us a call. (760) 908-3070, EasyLanguage and OOEL are our specialties. (For TradeStation and MultiCharts) We will give you a free estimate. Or, better yet, click on this link to send us an email, and thoroughly describe your idea. Remember, you are talking to a real trader who can also write code, not someone who just codes. | |||
Lane Mendelsohn
CEO, President
VantagePoint ai software
Phone: 1 800 732 5407
Lane Mendelsohn's email
Tell Lane I sent you. He is amenable to special favors for Sunny Harris students.
Watch Sunny's review of VantagePoint software. Read Sunny's review from TASC (Technical Analysis of Stocks & Commodities).
Samuel K. Tennis
"Ask Mr. EasyLanguage"
Vista-Research
Phone: 1 850 582-7342
sktennis@vista-research.com
www.vista-research.com
Tell Sam I sent you. He is amenable to special favors for Sunny Harris clients.
To see the description of the product and screenshots, go to the Products page here. For each product, clicking on the Product Name (in blue hyperlink) will take you to the pictures and descriptions.
Sam's Data Report Pro and SPGC Report Pro are sold separately for $299 each. Together as a Bundle they are just $499.
Here is the Documentation, so you can familiarize with their capabilities. To get a view of what these apps look like, click here to go to the Products page.
This is an indicator written in OOEL. I asked Sam to write it for me to make my real-time trading easier. It is open-source so you can see how it is done. Most of the time all you can see in TradeStation is the information for the hypothetical Strategy on the chart, not the real-time, real-life & updates. I really like, and need, this tool in my trading. This indispensible tool is only $495. Click above or here to see examples. Again, documentation is here.
This application allows you to quickly move right and left and back by clicking the form and not wasting time with the chart scroll bar. To see it on a chart, click here. Scroll The Chart is just $79.50.
This application allows you to quickly move right and left and back by clicking the form and not wasting time with the chart scroll bar. Additionally, this version is Docked at the location of your choice, left, right, bottom or top of your chart. To see it on a chart, click here. Scroll The Chart Docked is just $149.
Jeff Gibby
Senior Business Development Specialist
Thomson Reuters
Phone: 1 801 270 3162
Mobile: 1 801 503 8764
Jeffrey.Gibby@thomsonreuters.com
thomsonreuters.com
Skype Jeffrey.Gibby
Tell Jeff I sent you. He is amenable to special favors for Sunny Harris students.
I have my own special contact person there, who will give you special Sunny Harris consideration. His name is Mark Noel, and his number and email address are below. Tell him Sunny sent you.
Mark Noel
MultiCharts, LLC
U.S. Toll-Free and International: 1-888-340-6572
Direct phone line: 1-614-285-3456
mnoel@multicharts.com
I have my own special contact person there, who will give you special Sunny Harris consideration. His name is Jake Hinkle, and his email is jhinkle@tradestation.com. Tell him Sunny sent you.

You must sign, return and agree to the Disclaimer regarding these products before you may license or use any of them.
We reserve the right to change our pricing structure at any time with or without notice. Any old or published prices, regardless of location, then will not be honored.
* All items with physical delivery will be charged Shipping & Handling of $15.00.
Please add that to your calculations.
Sunny has been teaching others to trade almost as long as she has been trading. Helping struggling novices over the hurdles is a passion of hers. Sunny has won awards for her teaching and consulting, being #1 in several categories. Sunny can teach you how to use TradeStation & MultiCharts and EasyLanguage and PowerLanguage, TC2000, VantagePoint, NinjaTrader, Genesis Navigator, and MetaStock so you don't spend months struggling on your own. If you have a concept you want programmed, she can do it for you or teach you how to do it yourself. Click Here.
We provide a wide range of software programmed by Sunny for her own trading. We are not a churn and burn shop that puts out lots of indicators for sale, just to have products to sell.
Each of these unique products is available to help others in their quest for profits. And, they are used by Sunny in her own daily trading. The software includes indicators that make trading smooth and easy, and strategies that can even be automated to provide hands-off trading. Click here for a full list, descriptions, charts and prices.
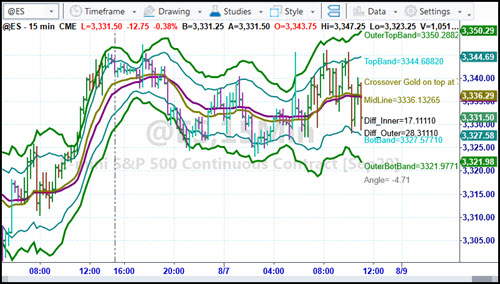
NOW AVAILABLE: Live Trading with Sunny EVERY MORNING. (Trade Along with Sunny - TAWS) Want to see and hear how Sunny trades with SunnyBands? Listen to her reasoning and watch as she places trades. Here's your chance. Subscribe Here.
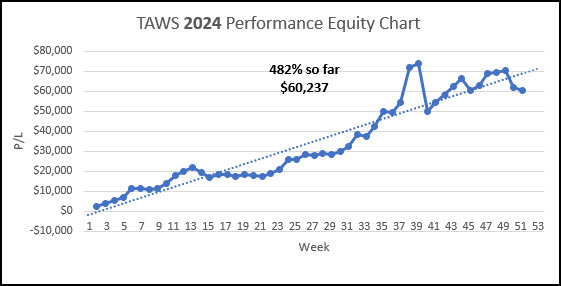
PERFORMANCE 2024 Year-End:
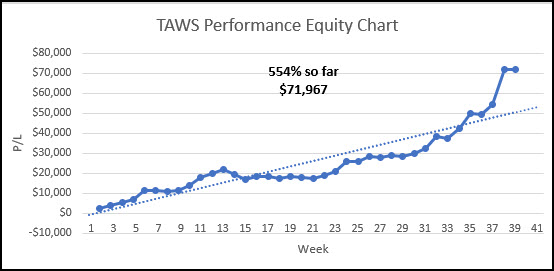
PERFORMANCE 2025 To Date
"Hi Sunny, wanted to share with you my profits for the day and say thank you! $19,412.50." -S. S., Mission Viejo, CA
"I wanted to let you know how helpful your daily trading room sessions have been. It is refreshing to see someone trade live and answer any questions that we have. It is so much better than a service that just wants to sell you something and send you on your way. This is really speeding up my learning and I look forward to trading along with you. Thanks for all you are doing to help people learn the art of trading." - Rick N.
"I had the fortune of meeting Sunny Harris and her excellent trade software SunnyBands. From the beginning, she gave me all her support, even though I didn't have any experience with day trade and English is not my first language she is always available for any questions. I tested SunnyBands free trial and the results were amazing $3.5K in the first week, I asked for another free trial and she was able to help me, I did it again, and after these records, I decided to buy the license for Sunny Bands. Thank Sunny for your unconditional support and your excellent software." -Juan R.
"I have studied swing and day trading for 10 years primarily with Gann methodology but I might be able to say I have studied it all. I lead a monk's life studying 12 hrs a day. I have found SunnyBands correlate to the high work of mathematics in price and one tool I treasure now for my chart analysis and trading. The first day I loaded SunnyBands I made $275 with one contract in about a minute; I thought to myself how can this small monthly fee not pay for itself? The opportunity to trade with such an experienced trader as Sunny is a real gift; the experience you will get in a year will be priceless. Doing this each trading day with Sunny will train your subconscious mind to become a consistent winner in the market. If you are thinking with a poverty mindset you will have a long hard road; don't do that. This is really awesome to be able to trade with each day and so appreciative of you doing this. To live trade as a mentor like you do is very hard and much respect and appreciation for you doing this Sunny!" - Arthur M.
"Well, I just want to say the I LOVE them !!!! ( your bands )....I've torn apart Bollinger Bands, Keltner etc, etc... and NOTHING comes CLOSE to what YOU have created.... :-) I've talked to CMT's who've said "oh yeah.... they're just Bollies".....and I almost spit out my coffee! I've watched your videos where you are walking a new customer through their use... and I "got it all" ( understood )... the "turns" are RIGHT THERE!.... Bollies are too general....and Keltner which Rashke says she likes....are only a hair better than Bollies.... YOURS blows both of them away.....of course YOU already know that." - Marius V.
The Podcasts of John Bolllinger, Steve Nison, Gene Inger, Hima Reddy, Brad Matheny, William Eng, Louis Navellier, Cynthia Kase, Howard Getson, Jake Bernstein, Arch Crawford, Henry Weingarten, Robert Pardo, Sherman & Tom McClellan, Stan Ehrlich, Steven Primo, Carolyn Boroden, Markus Heitkoetter, Dan Passarelli, Ted Hearne, Larry Pesavento, Norm Winski, Greg Morris, Larry Williams, Linda Bradford Raschke, Anka Metcalf and Robert Colby are now posted. Enjoy these great interviews. And after that whom would you like to see next?
You've had plenty of opportunites to watch how Sunny trades. There's the Live Trading Room, lots of Appearances, YouTube videos and Live Demos. If you have not yet been introduced to SunnyBands and how Sunny uses them, sign up here to get the Replay of the event.
WHAT ARE YOU MISSING?
Several features of Sunny Side of the Street are missing from previous issues. Natural Numbers, Scan of Stocks, DMA_H RS, PHW Scan, and more. What would you like to see me bring back? Comments.
HAPPY HALF HOUR! We will have the next HHH on Saturday January 4th at 1:15pm PT.Sam Tennis and I will be hosting the Next Free Networking Event for all Traders new and old to join in the discussion and "get to know each other" event. It's a great place to make new friends. Sign Up Here. This Free meeting of like minds will be held once a month, on the 4th of each month. We all have a great time and share liberally on the 4th of evey month. It's a lot of fun! Don't miss it next time. Click HERE to join us. You must be registered to get the invitation and link.
Free Live Demo Replay available Here.
If you would like to continue receiving this weekly newsletter every week, please SUBSCRIBE. It helps the cause.
FREE 7-Day Trial of Sunny's Most Powerful Indicators. Click Here. You have 7 (calendar) days to use it' full functionality and learn! I can only take 20 trials per month and all start on a Monday. Get your request in early.
EasyLanguage Forum Want to learn EasyLanguage (EZL) the EASY way? Here is the REPLAY (with video and slides). 5 1-hr lessons will take you through all the steps with Sunny Harris and Sam Tennis.
FREE 7-day Trial of Sunny's most Powerful trading indicators. Not sure about buying them? Take the trial. Most make enough during the Free Trial to cover the investment.
 The Definitive Guide to TradeStation's EasyLanguage & OOEL Programming--Vol I: Programming Guide and Vol II: Reference Guide
NOW AVAILABLE on Amazon.com.
The Definitive Guide to TradeStation's EasyLanguage & OOEL Programming--Vol I: Programming Guide and Vol II: Reference Guide
NOW AVAILABLE on Amazon.com.
Go to www.easylanguageooel.com, register as a Free Member and I'll send your FREE indicators wi th your proof of purchase
Address:
Oceanside, CA 92057
Cell: 760-908-3070 PT
Fax: 760-903-2260
Skype: sunnyjharris
EMail: sunny@moneymentor.com
